

Bank treasurers are optimistic that the negative fair value in their bond portfolios will soon be resolved. Last quarter, the negative gap between the fair value of their combined held-to-maturity and available-for-sale portfolios and their respective amortized cost fell to 5%, down from 11% three years ago. This improvement is partly due to portfolio roll-off and partly to mortgage rates falling and stabilizing at levels still high relative to pre-Global Financial Crisis rates, but lower than they were three years ago, when Silicon Valley Bank failed (Slide 1).
The shape of the yield curve has undergone a significant transformation since the start of the new year. The front end of the Treasury curve, from 3 months to 5 years, bear-flattened and then steepened from inverted to positively sloped (Slide 2). Meanwhile, the belly of the curve flattened (Slide 3).
Since 2022, a higher-rate environment has pushed term premia across all Treasury zero-coupon bonds into positive territory. Currently, a 10-year zero-coupon bond offers an 80-basis-point premium for extending the term rather than rolling over cash daily for 10 years. This is a shift from minus 60 basis points in 2020. Before the financial crisis, investors earned over 100 basis points for maintaining such long-term positions (Slide 4).
Kevin Warsh formed a task force to explore reducing the Fed’s balance sheet. However, to provide clear direction, he should first understand why the Treasury is now holding nearly $1 trillion in the Treasury General Account (TGA), compared with just a few billion dollars before the Global Financial Crisis (Slide 5). Additionally, even if reducing the Fed’s balance sheet is a goal, he and the Treasury Secretary must determine how to manage the growing flow of Treasury debt entering the market, which continues to displace other capital-market debt (Slide 6).
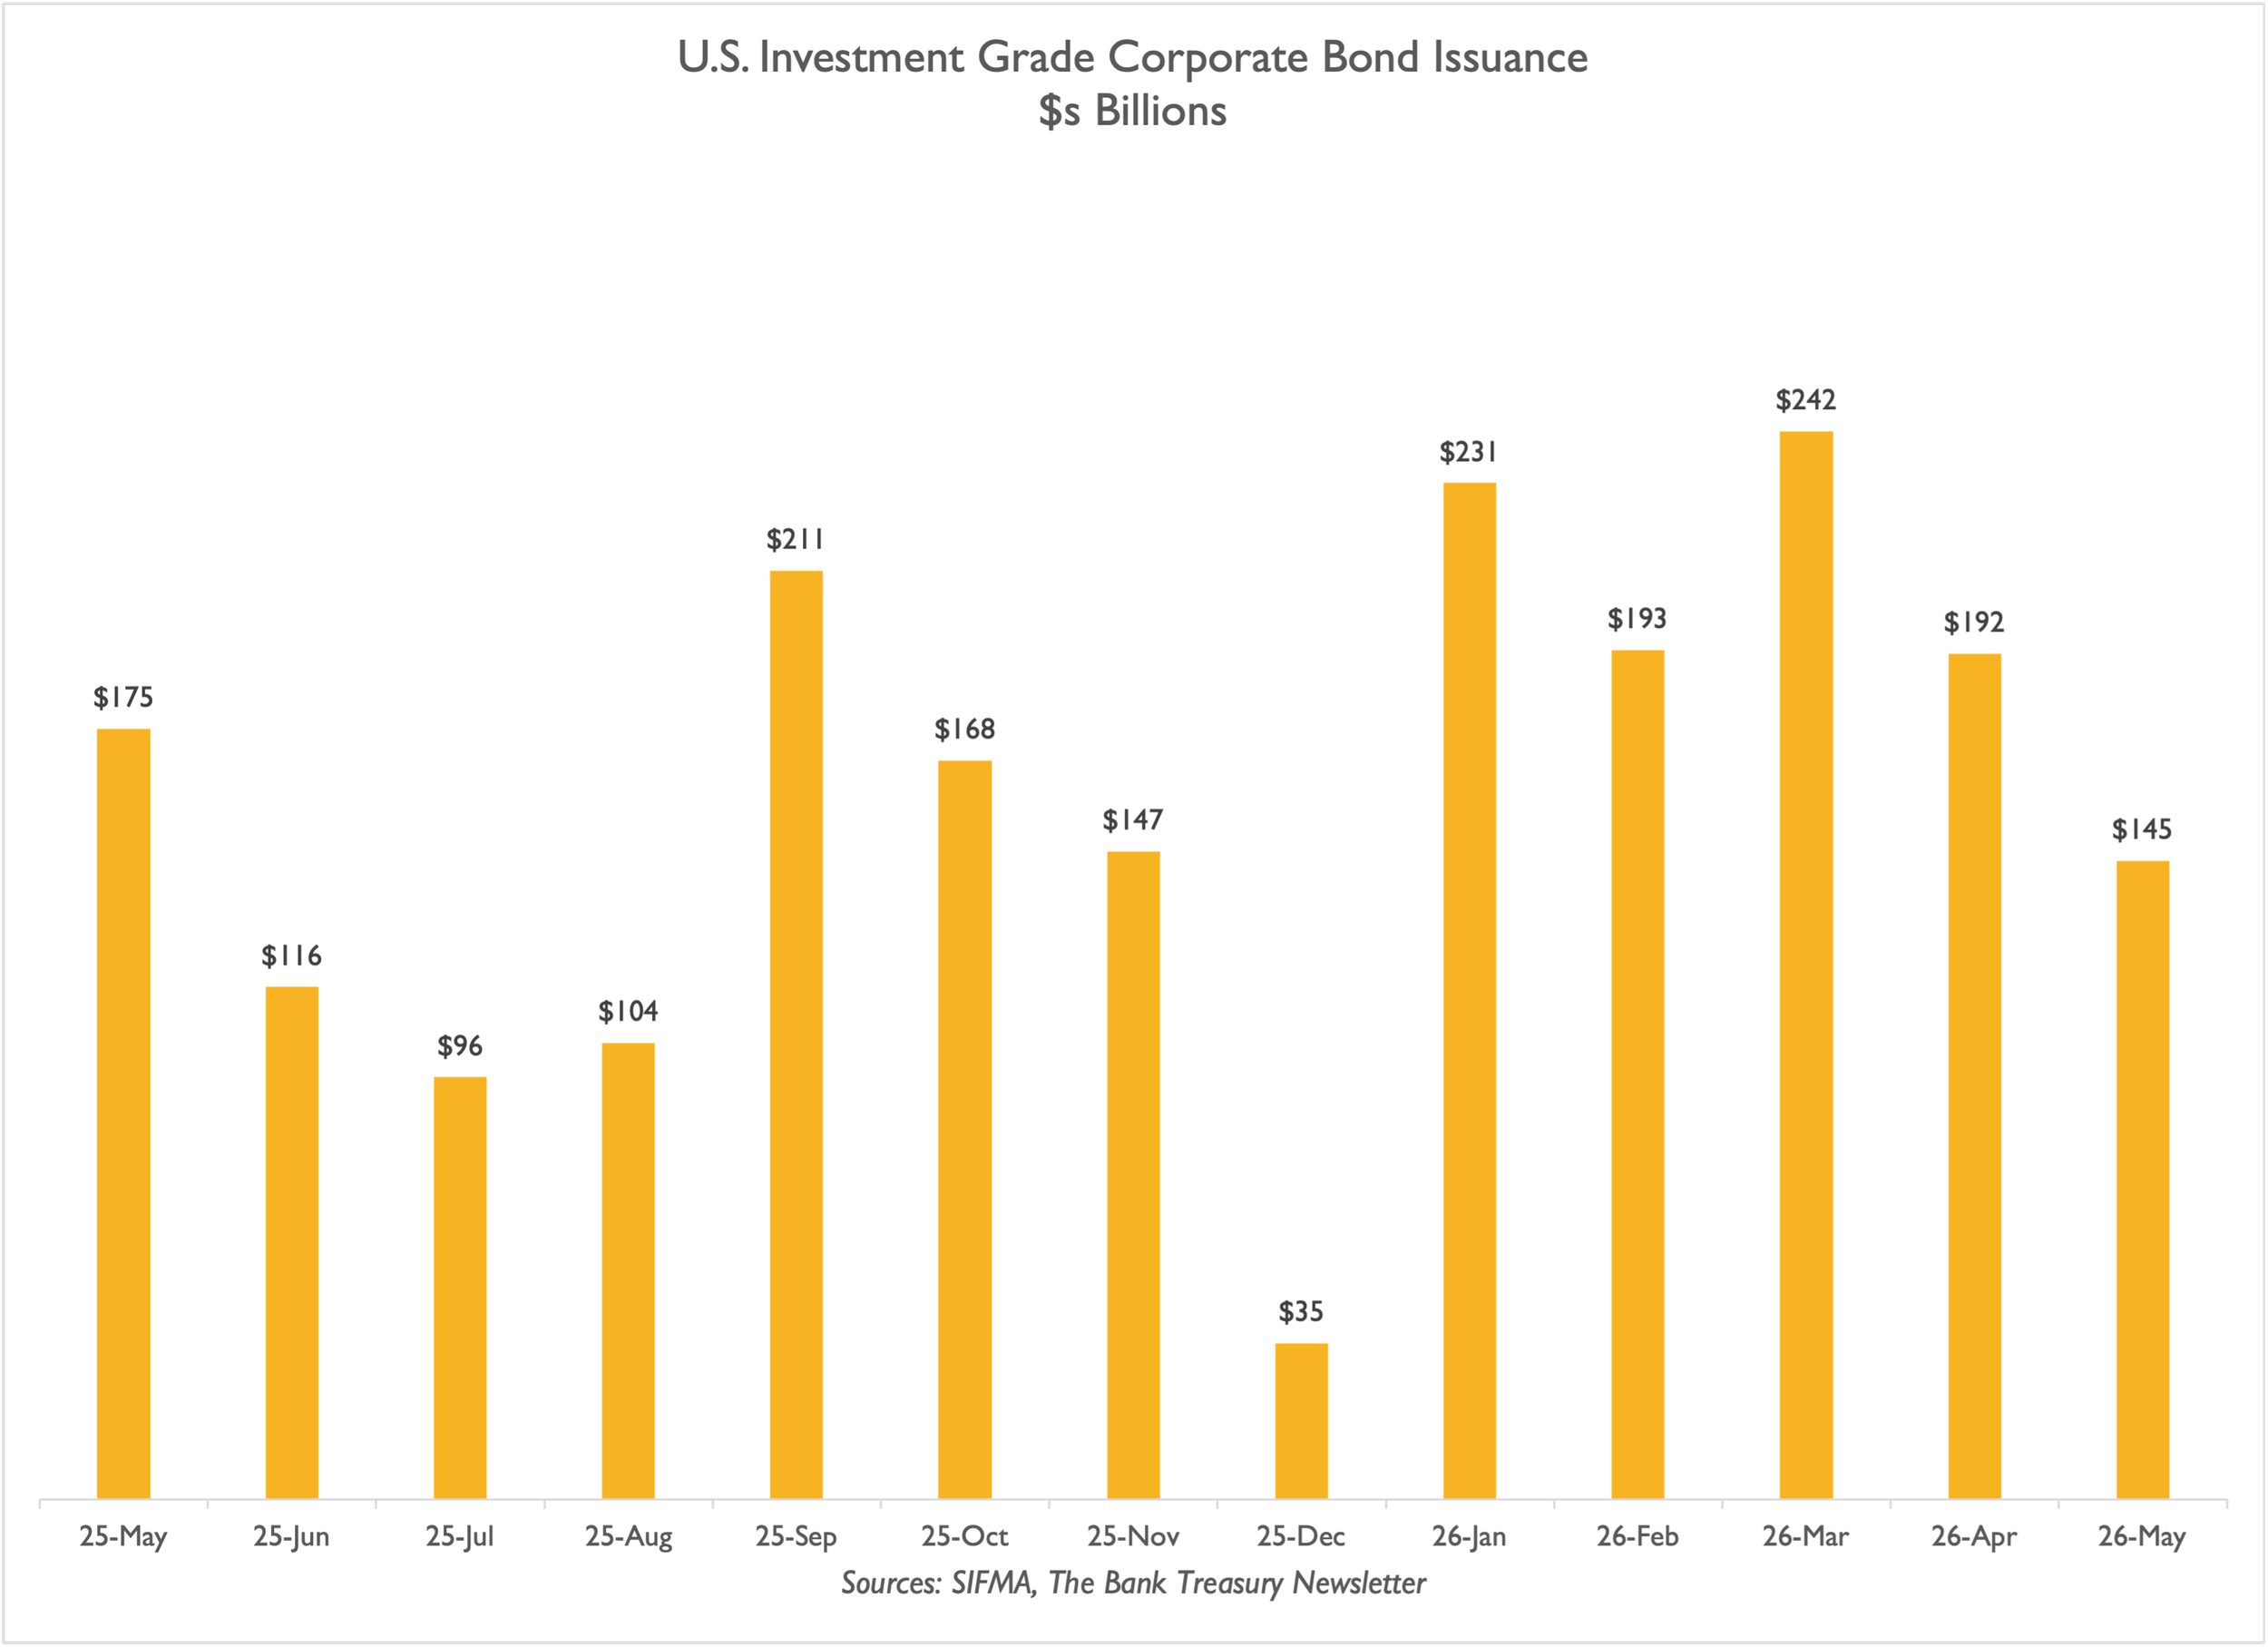
But high-grade corporate bond issuance rocketed higher this year, reaching $1 trillion in just the first five months (Slide 7), while a steeper yield curve incentivized them to extend the duration of their bond portfolios (Slide 8).
In bank treasury land, the news remains positive. Both loans and deposits are growing ($13 trillion and $19 trillion, respectively), allowing bank treasurers to run off some of their brokered deposit funding over the last six months, although they notably increased their advances from the FHLBs over the same period (Slide 9). Even as deposits grew, money market funds also grew, adding another $100 billion in assets under management since the new year, bringing total assets under management to $8.4 trillion (Slide 10).

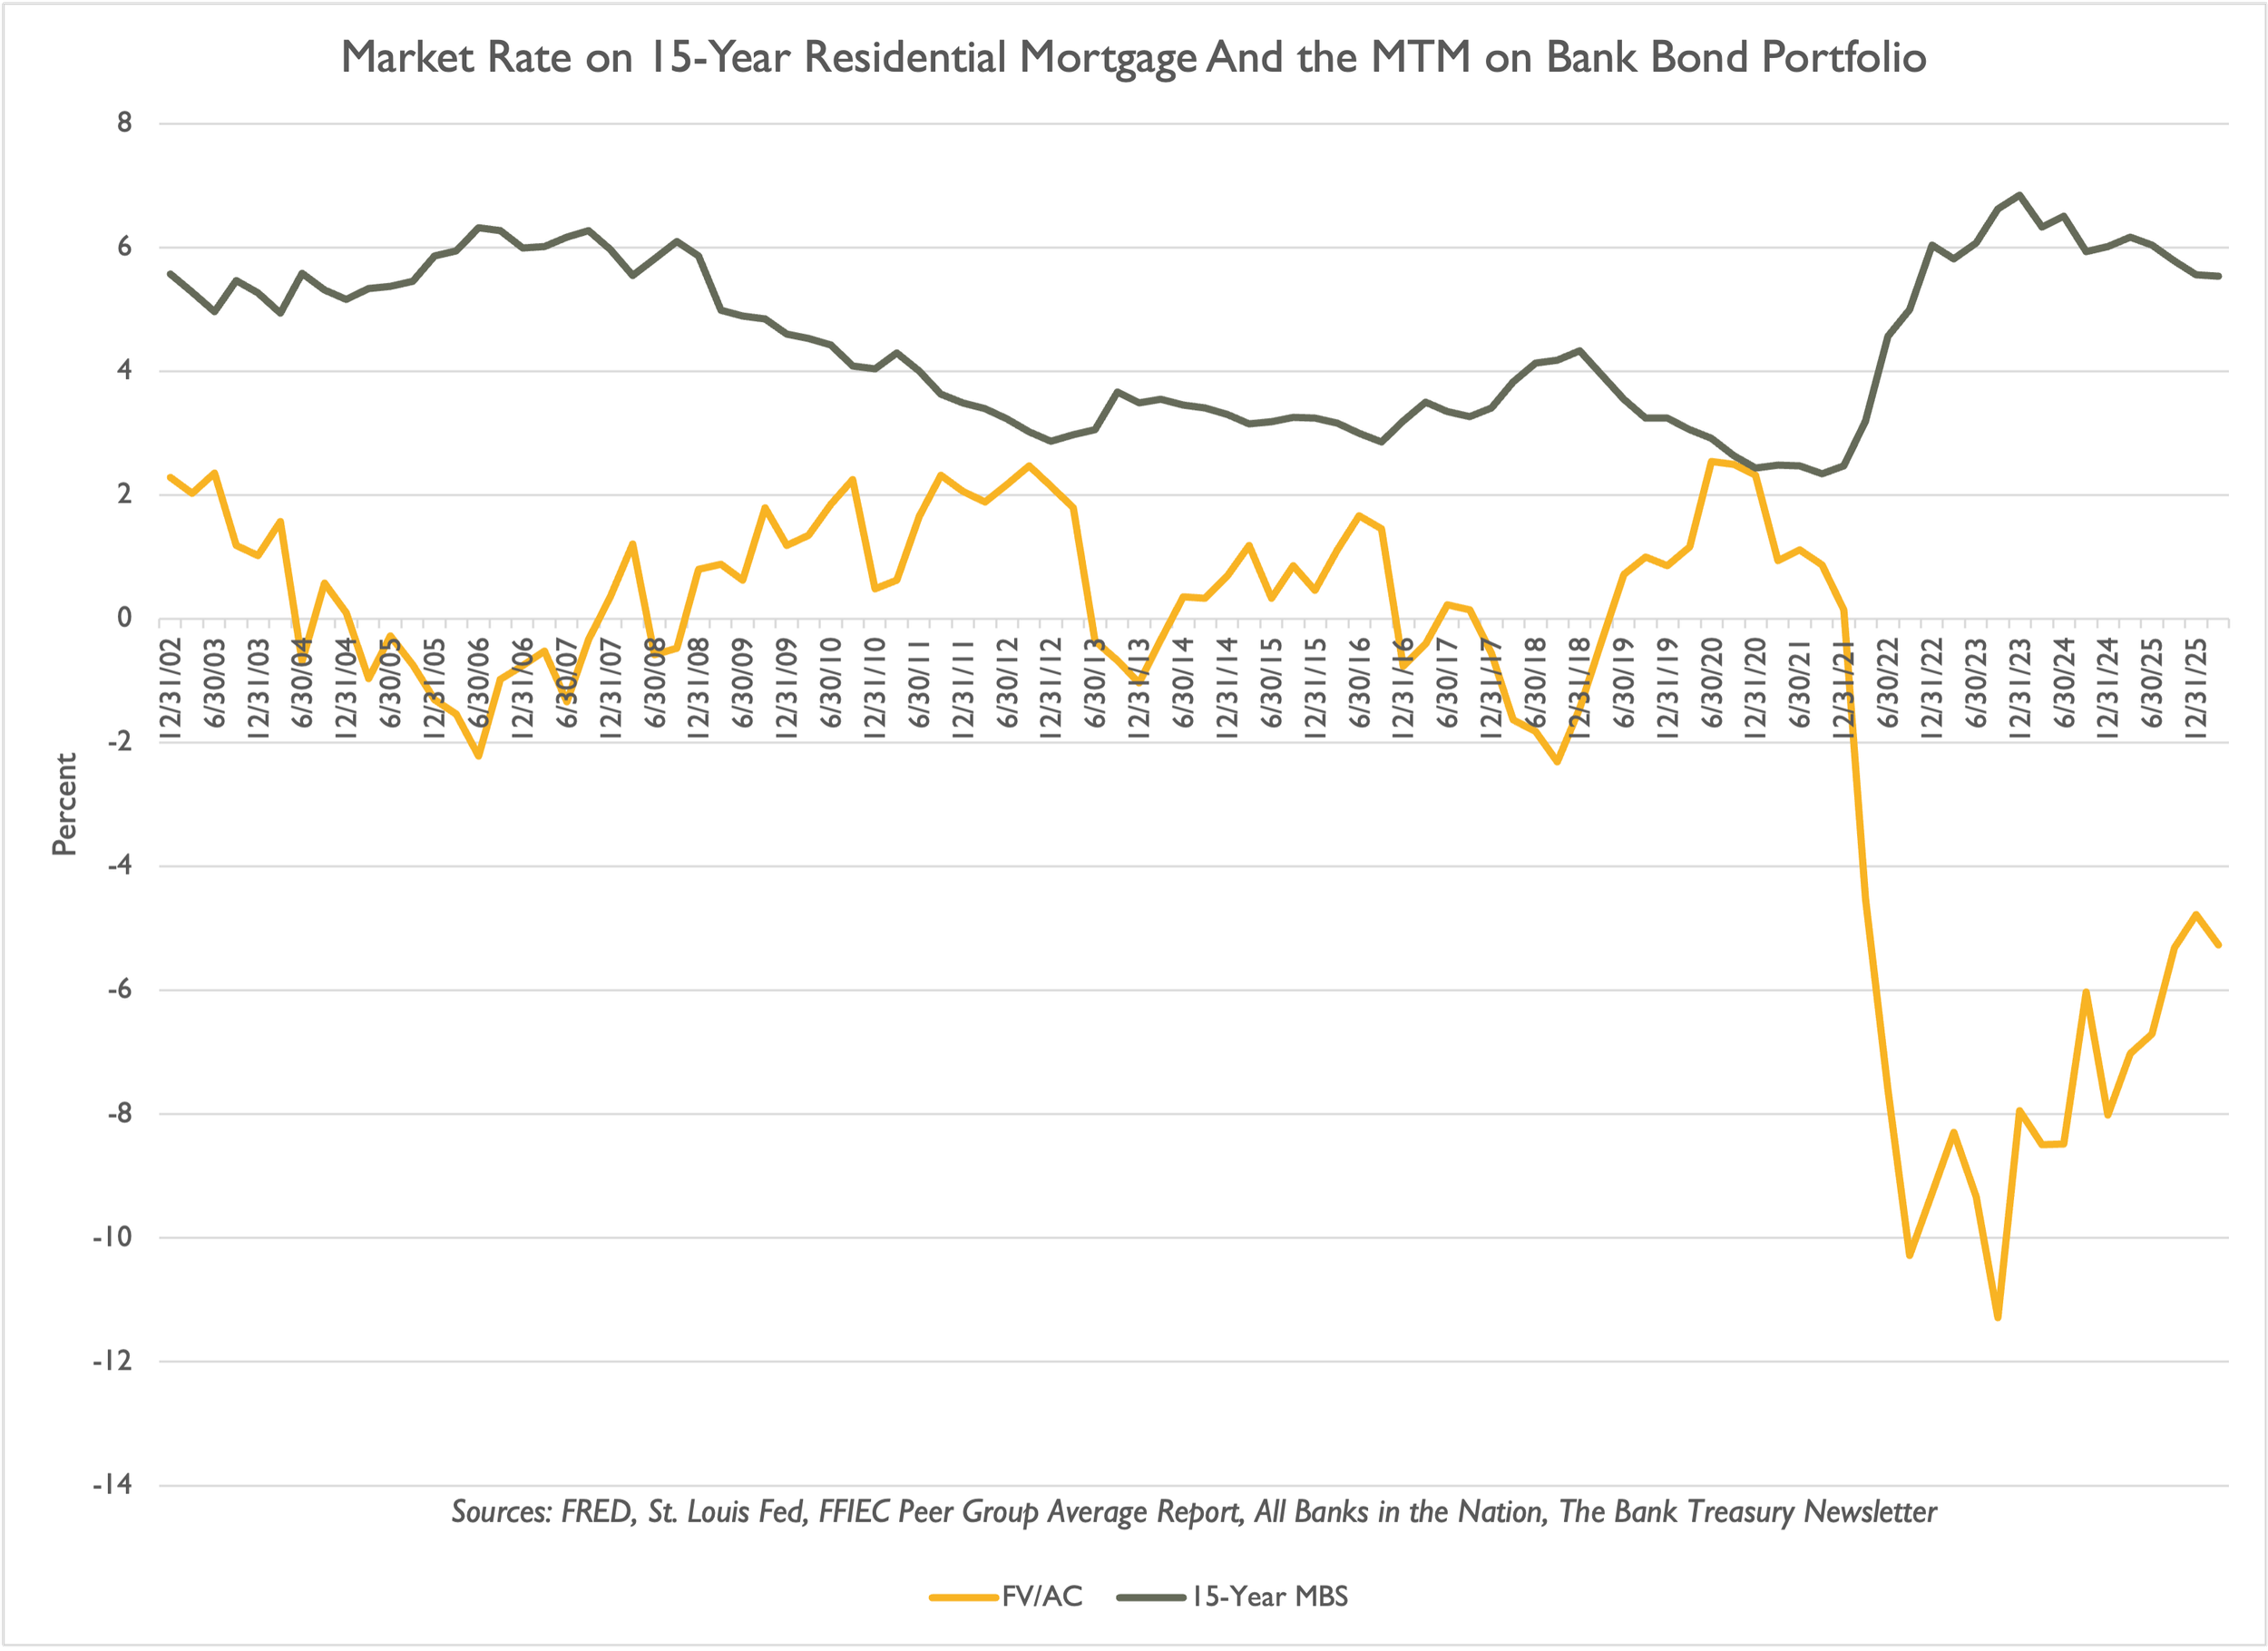

Bond Portfolios Are Still Climbing Back to Par
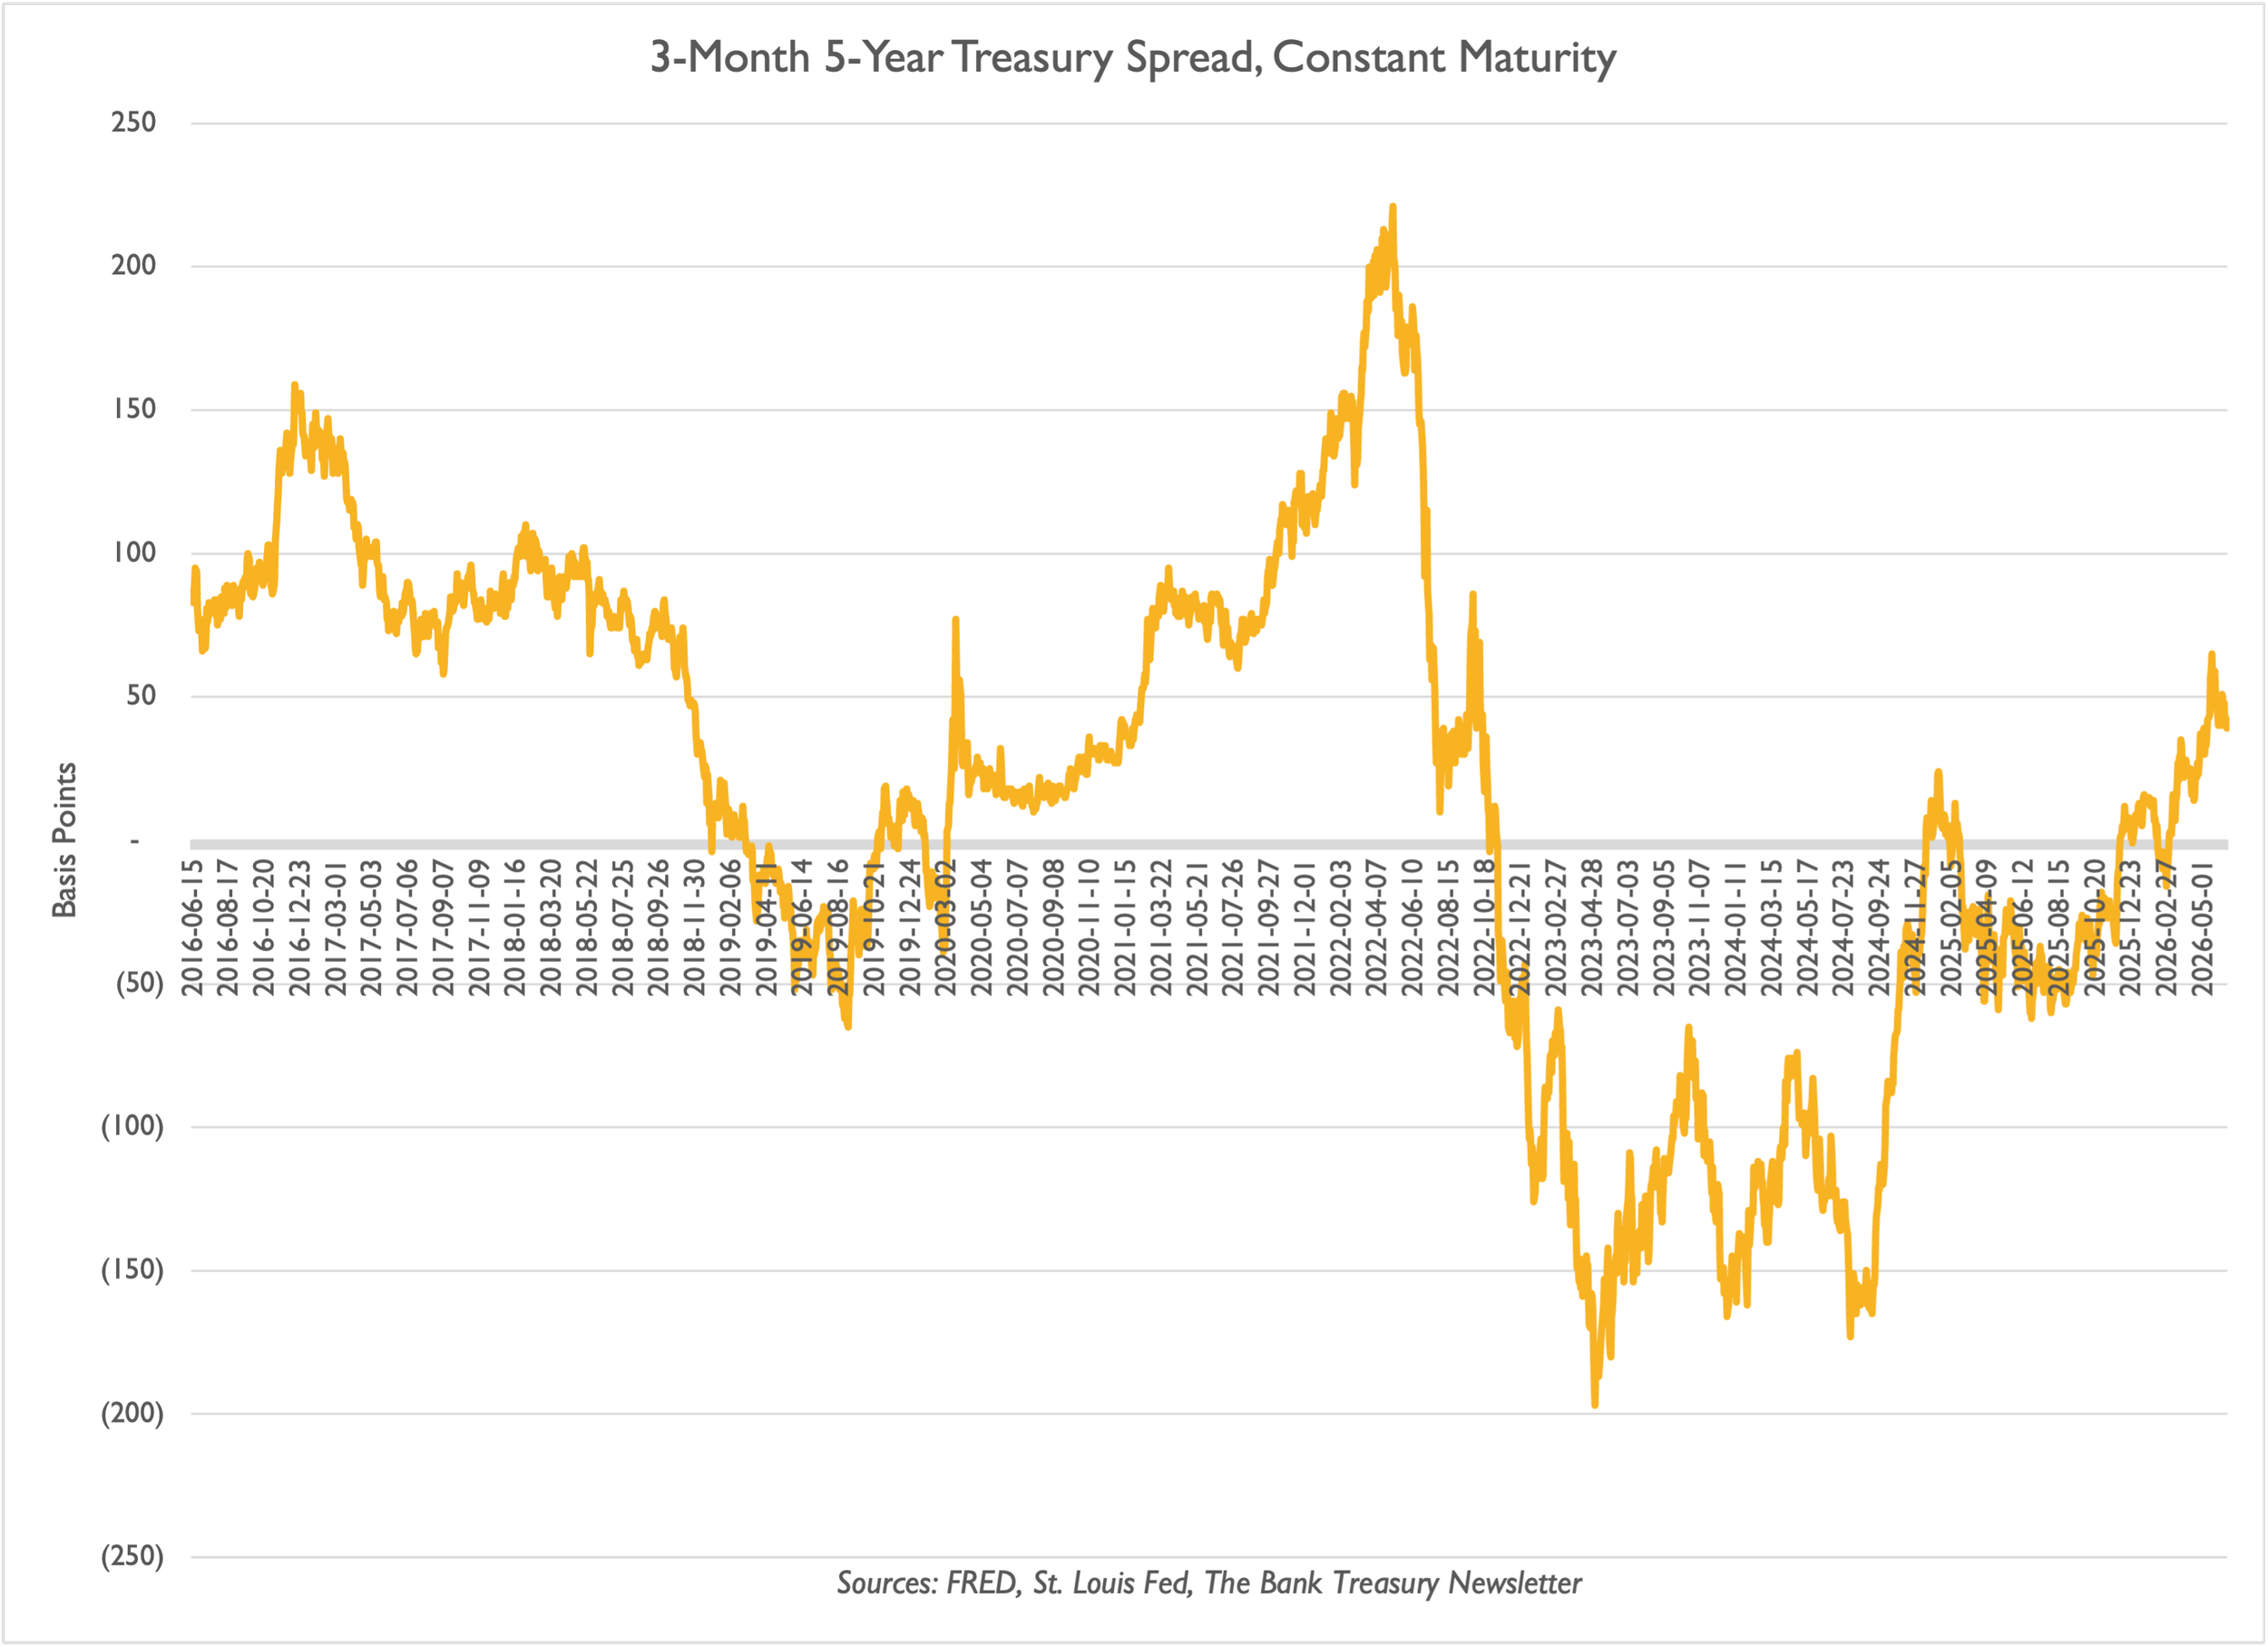
Front-End Steepens as Rate Hike Odds Grow…

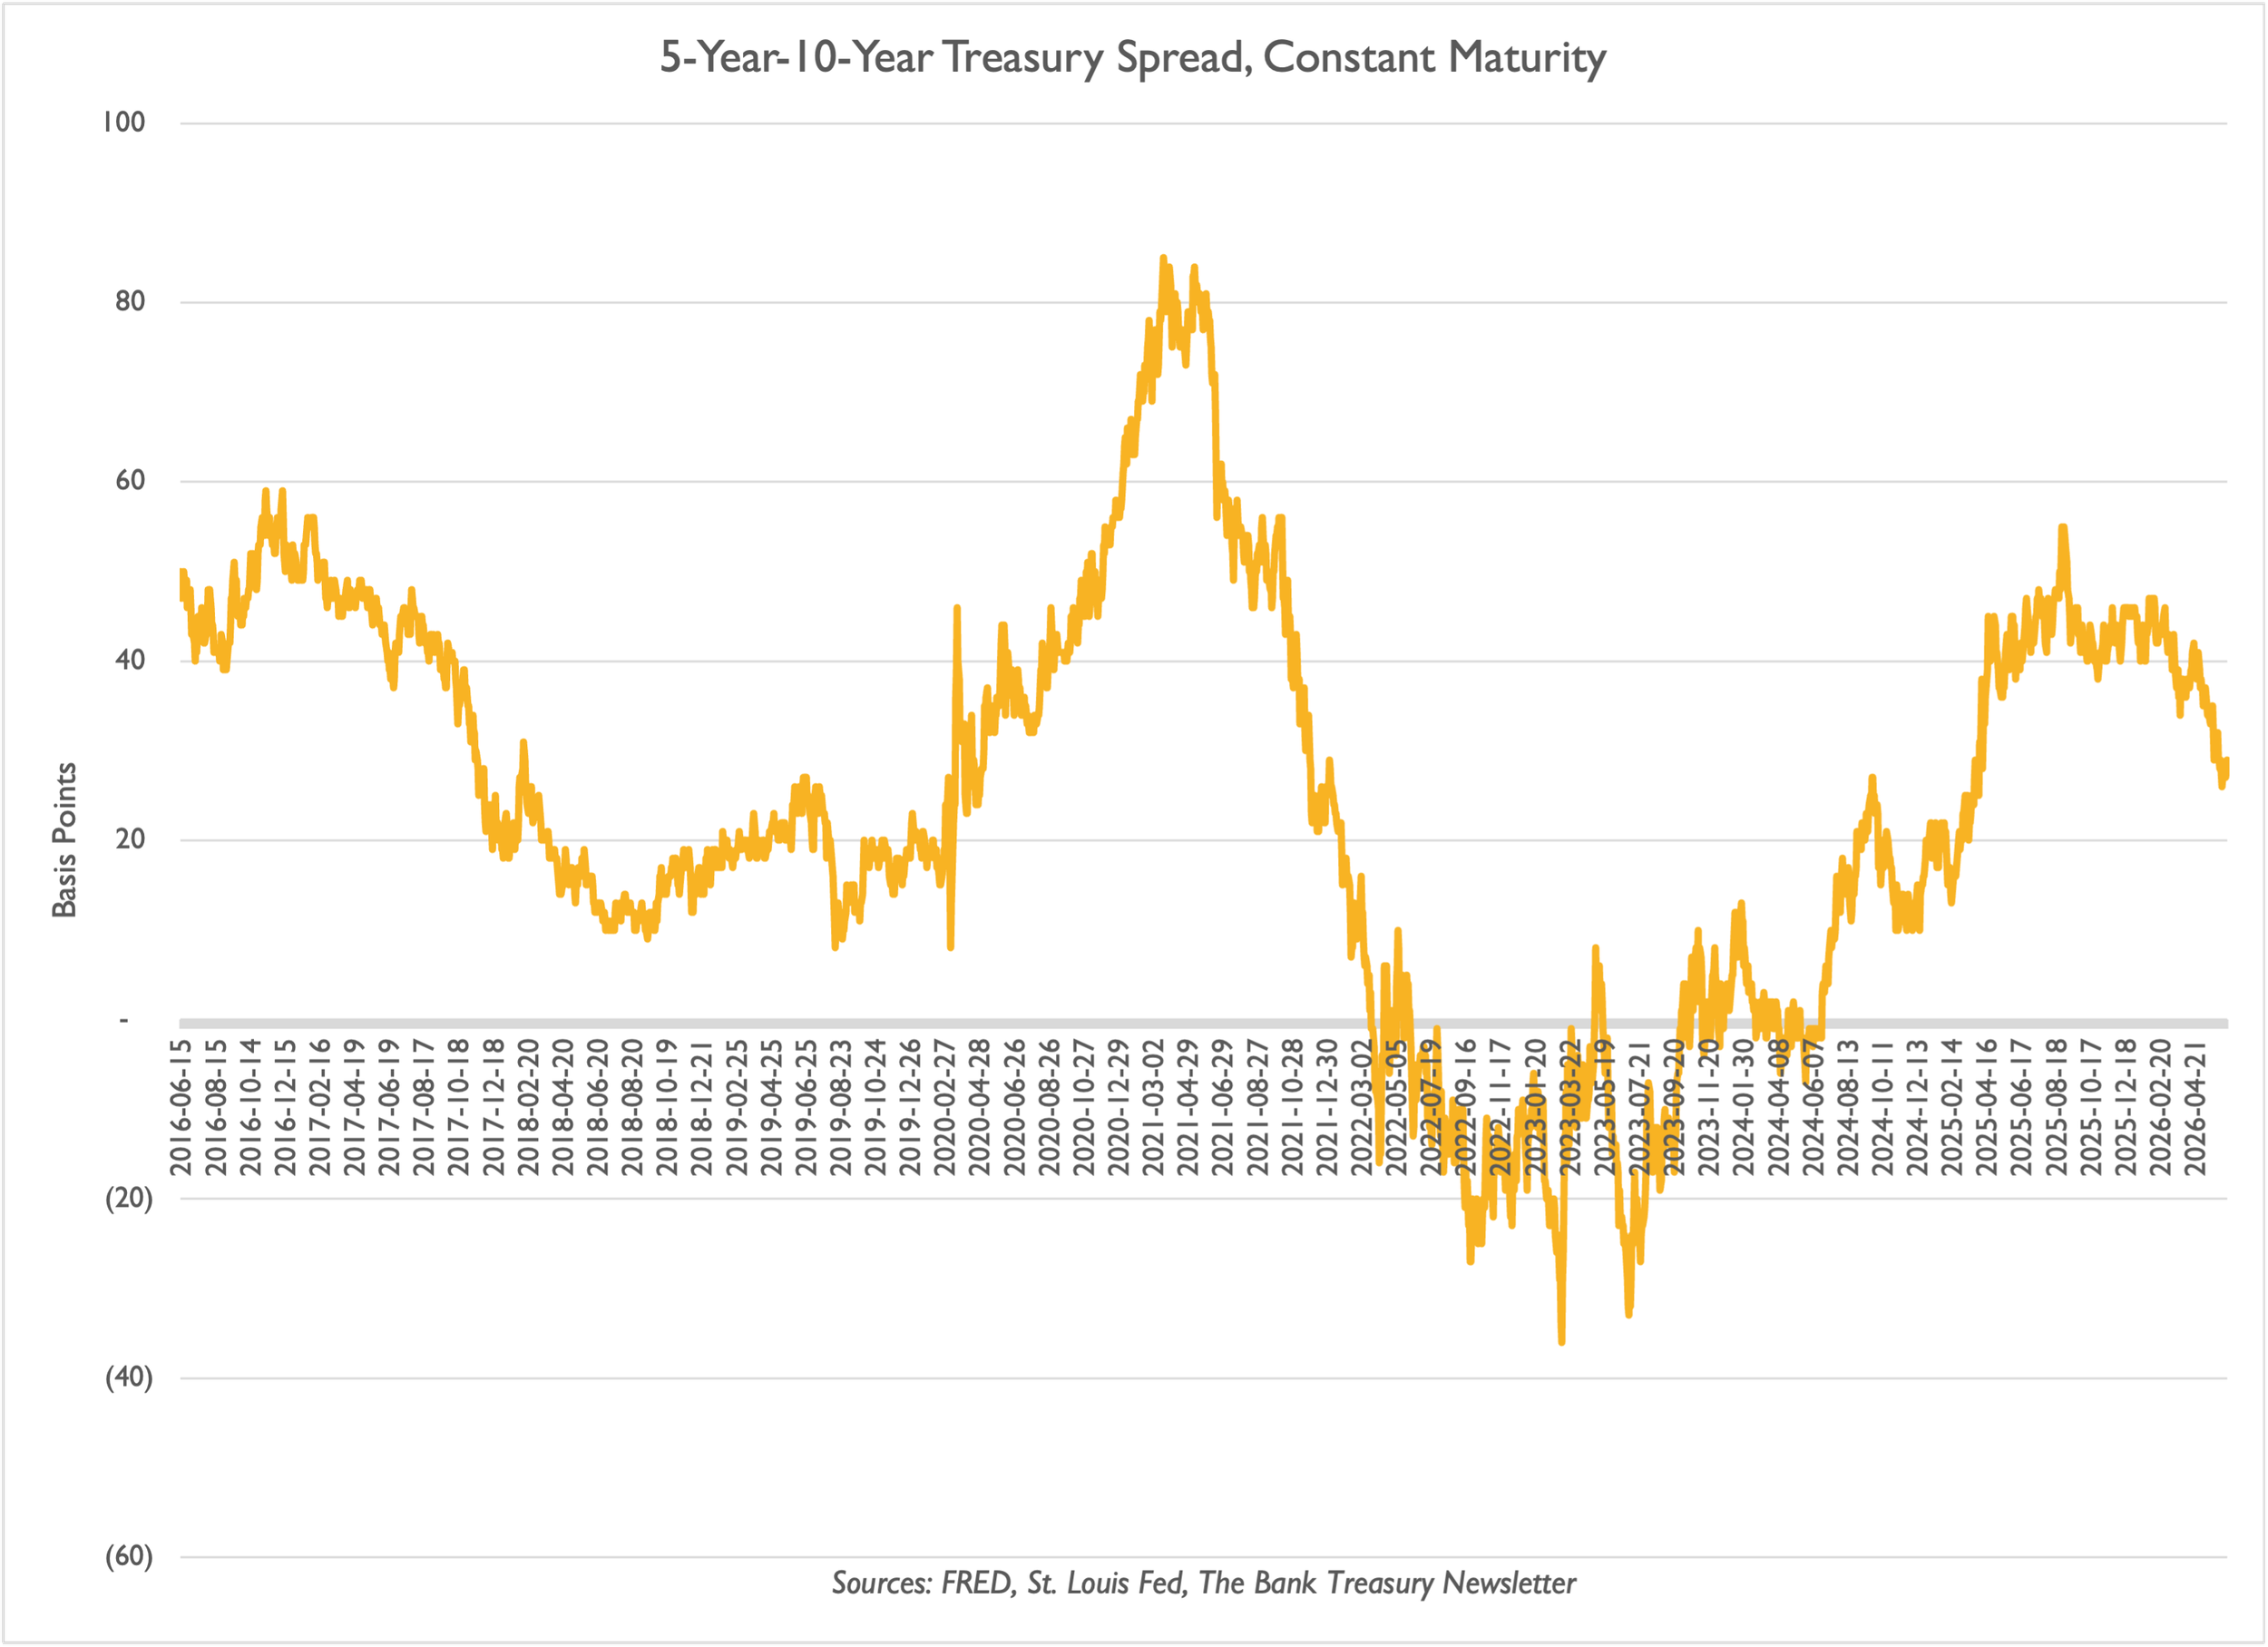
…But the Belly of the Curve Keeps Flattening

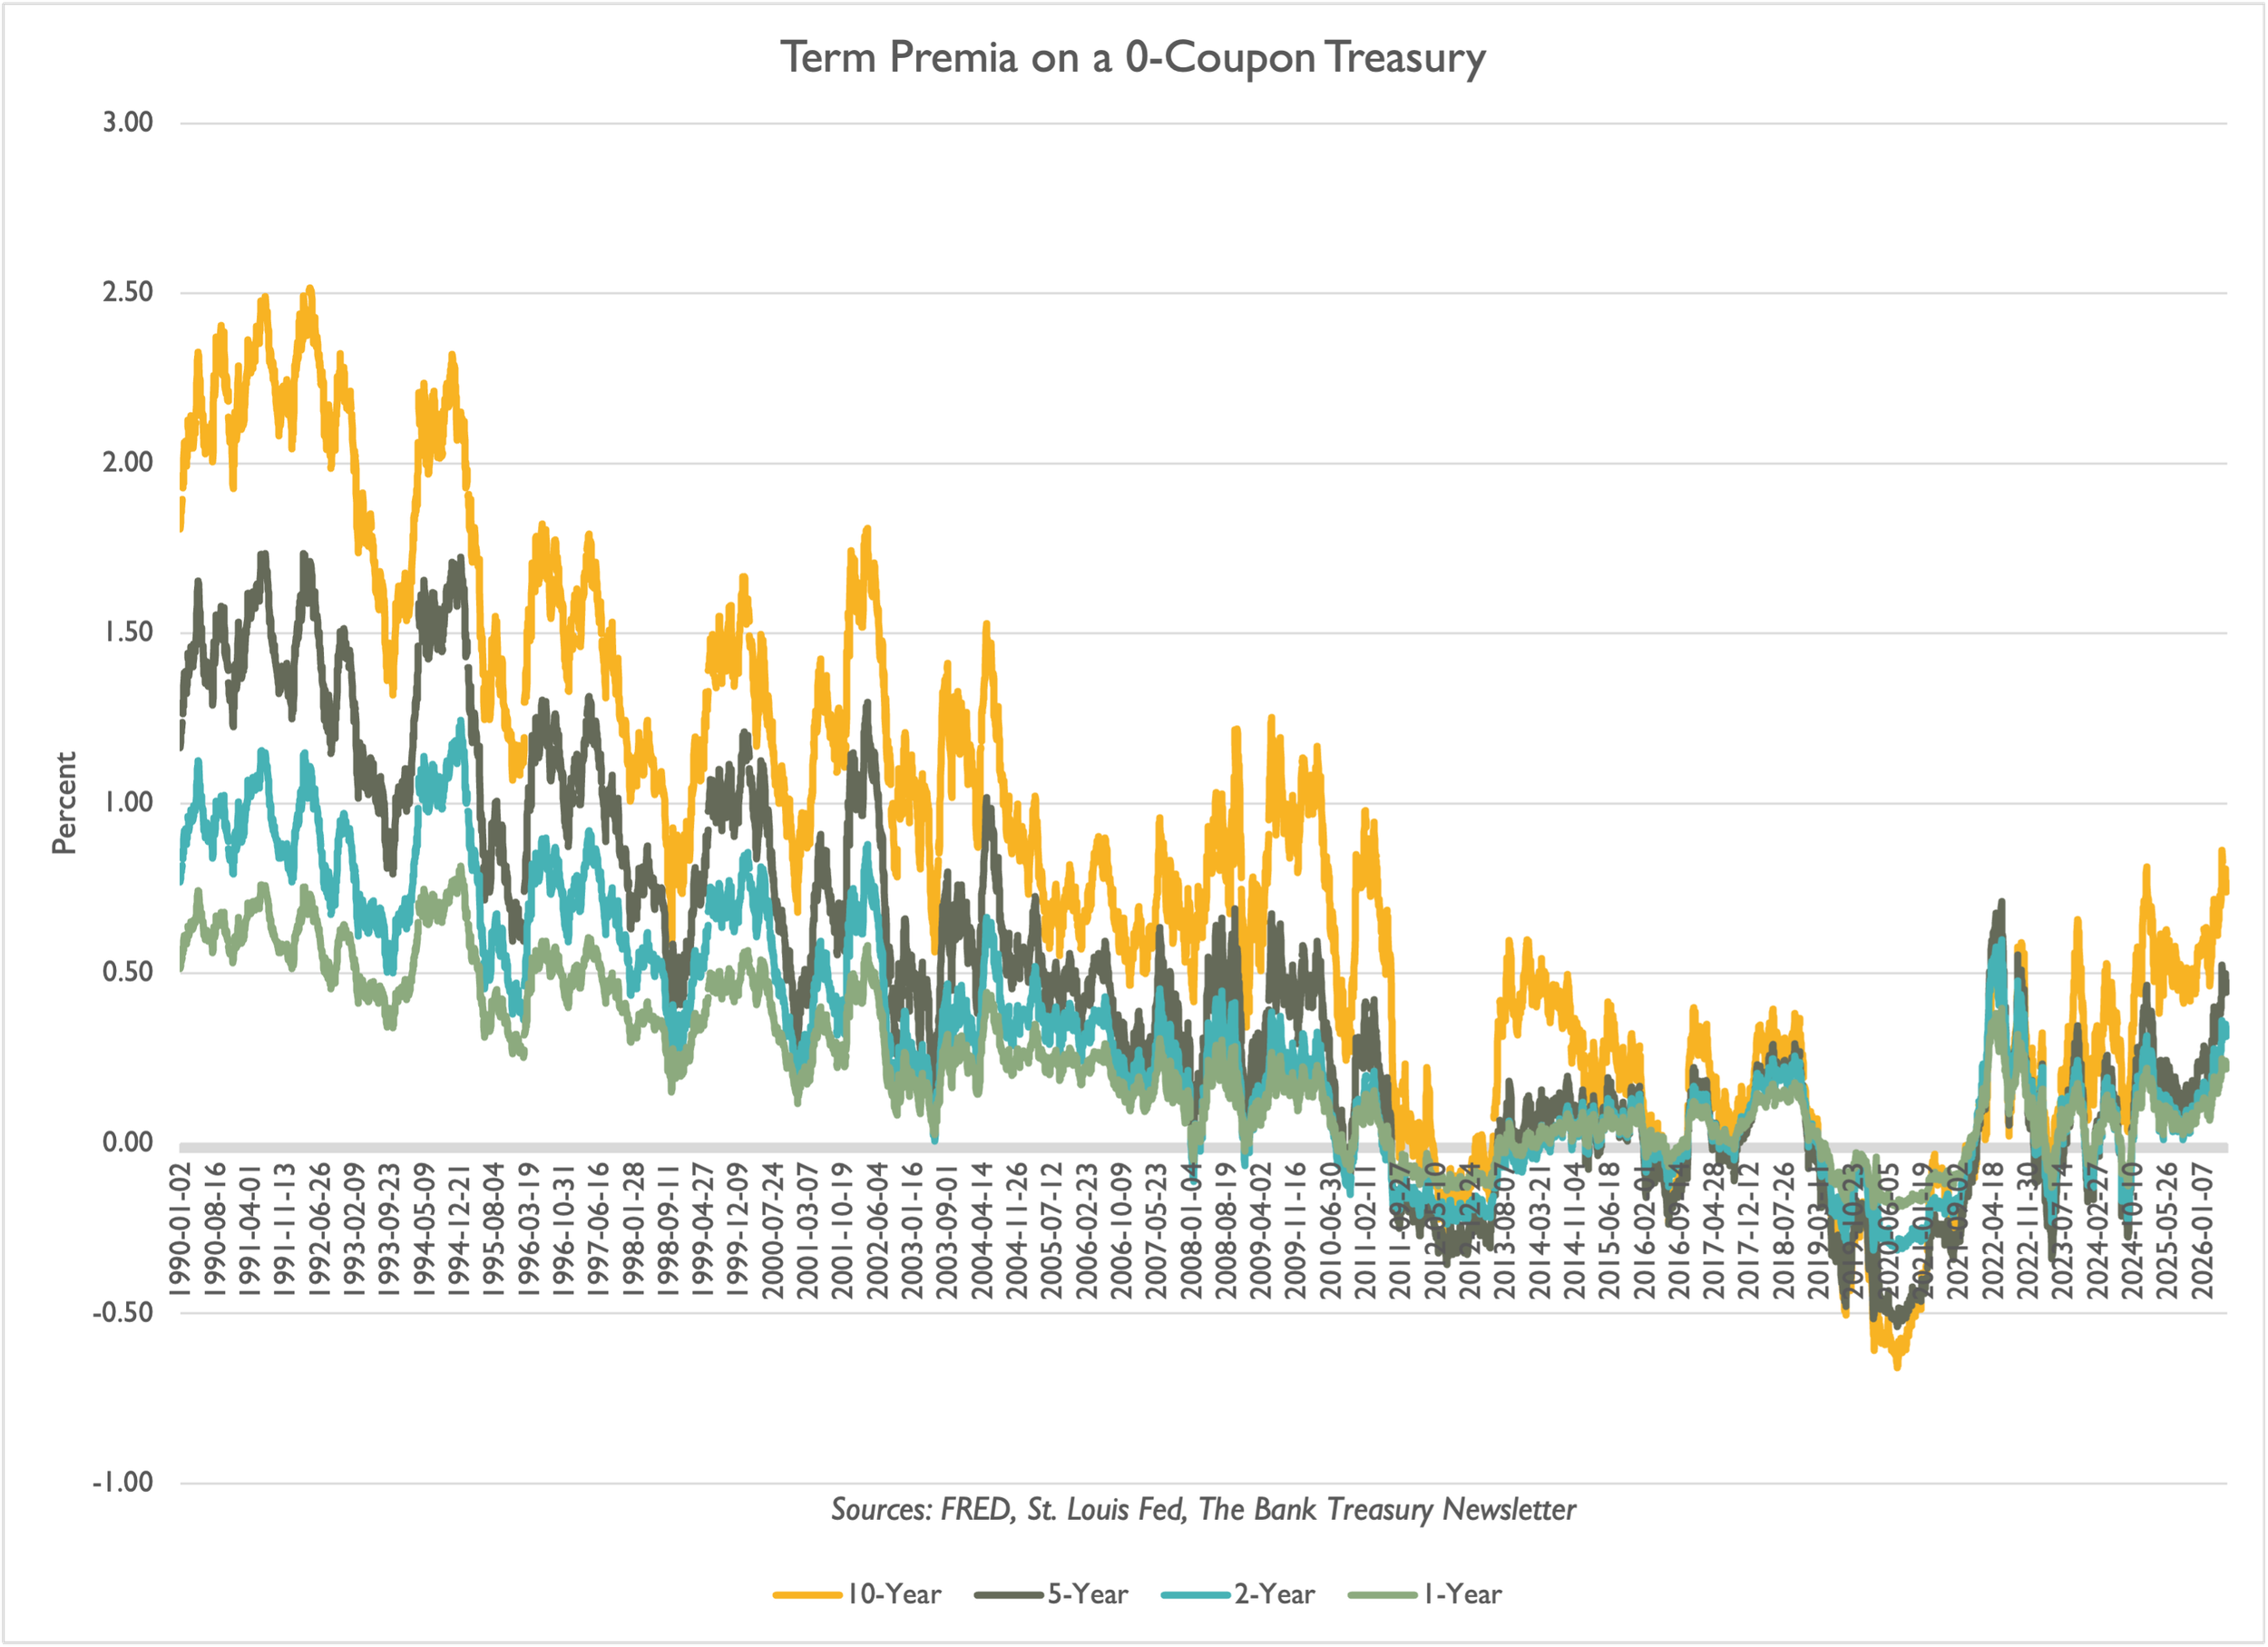
Investors Earn Higher Returns on Extension
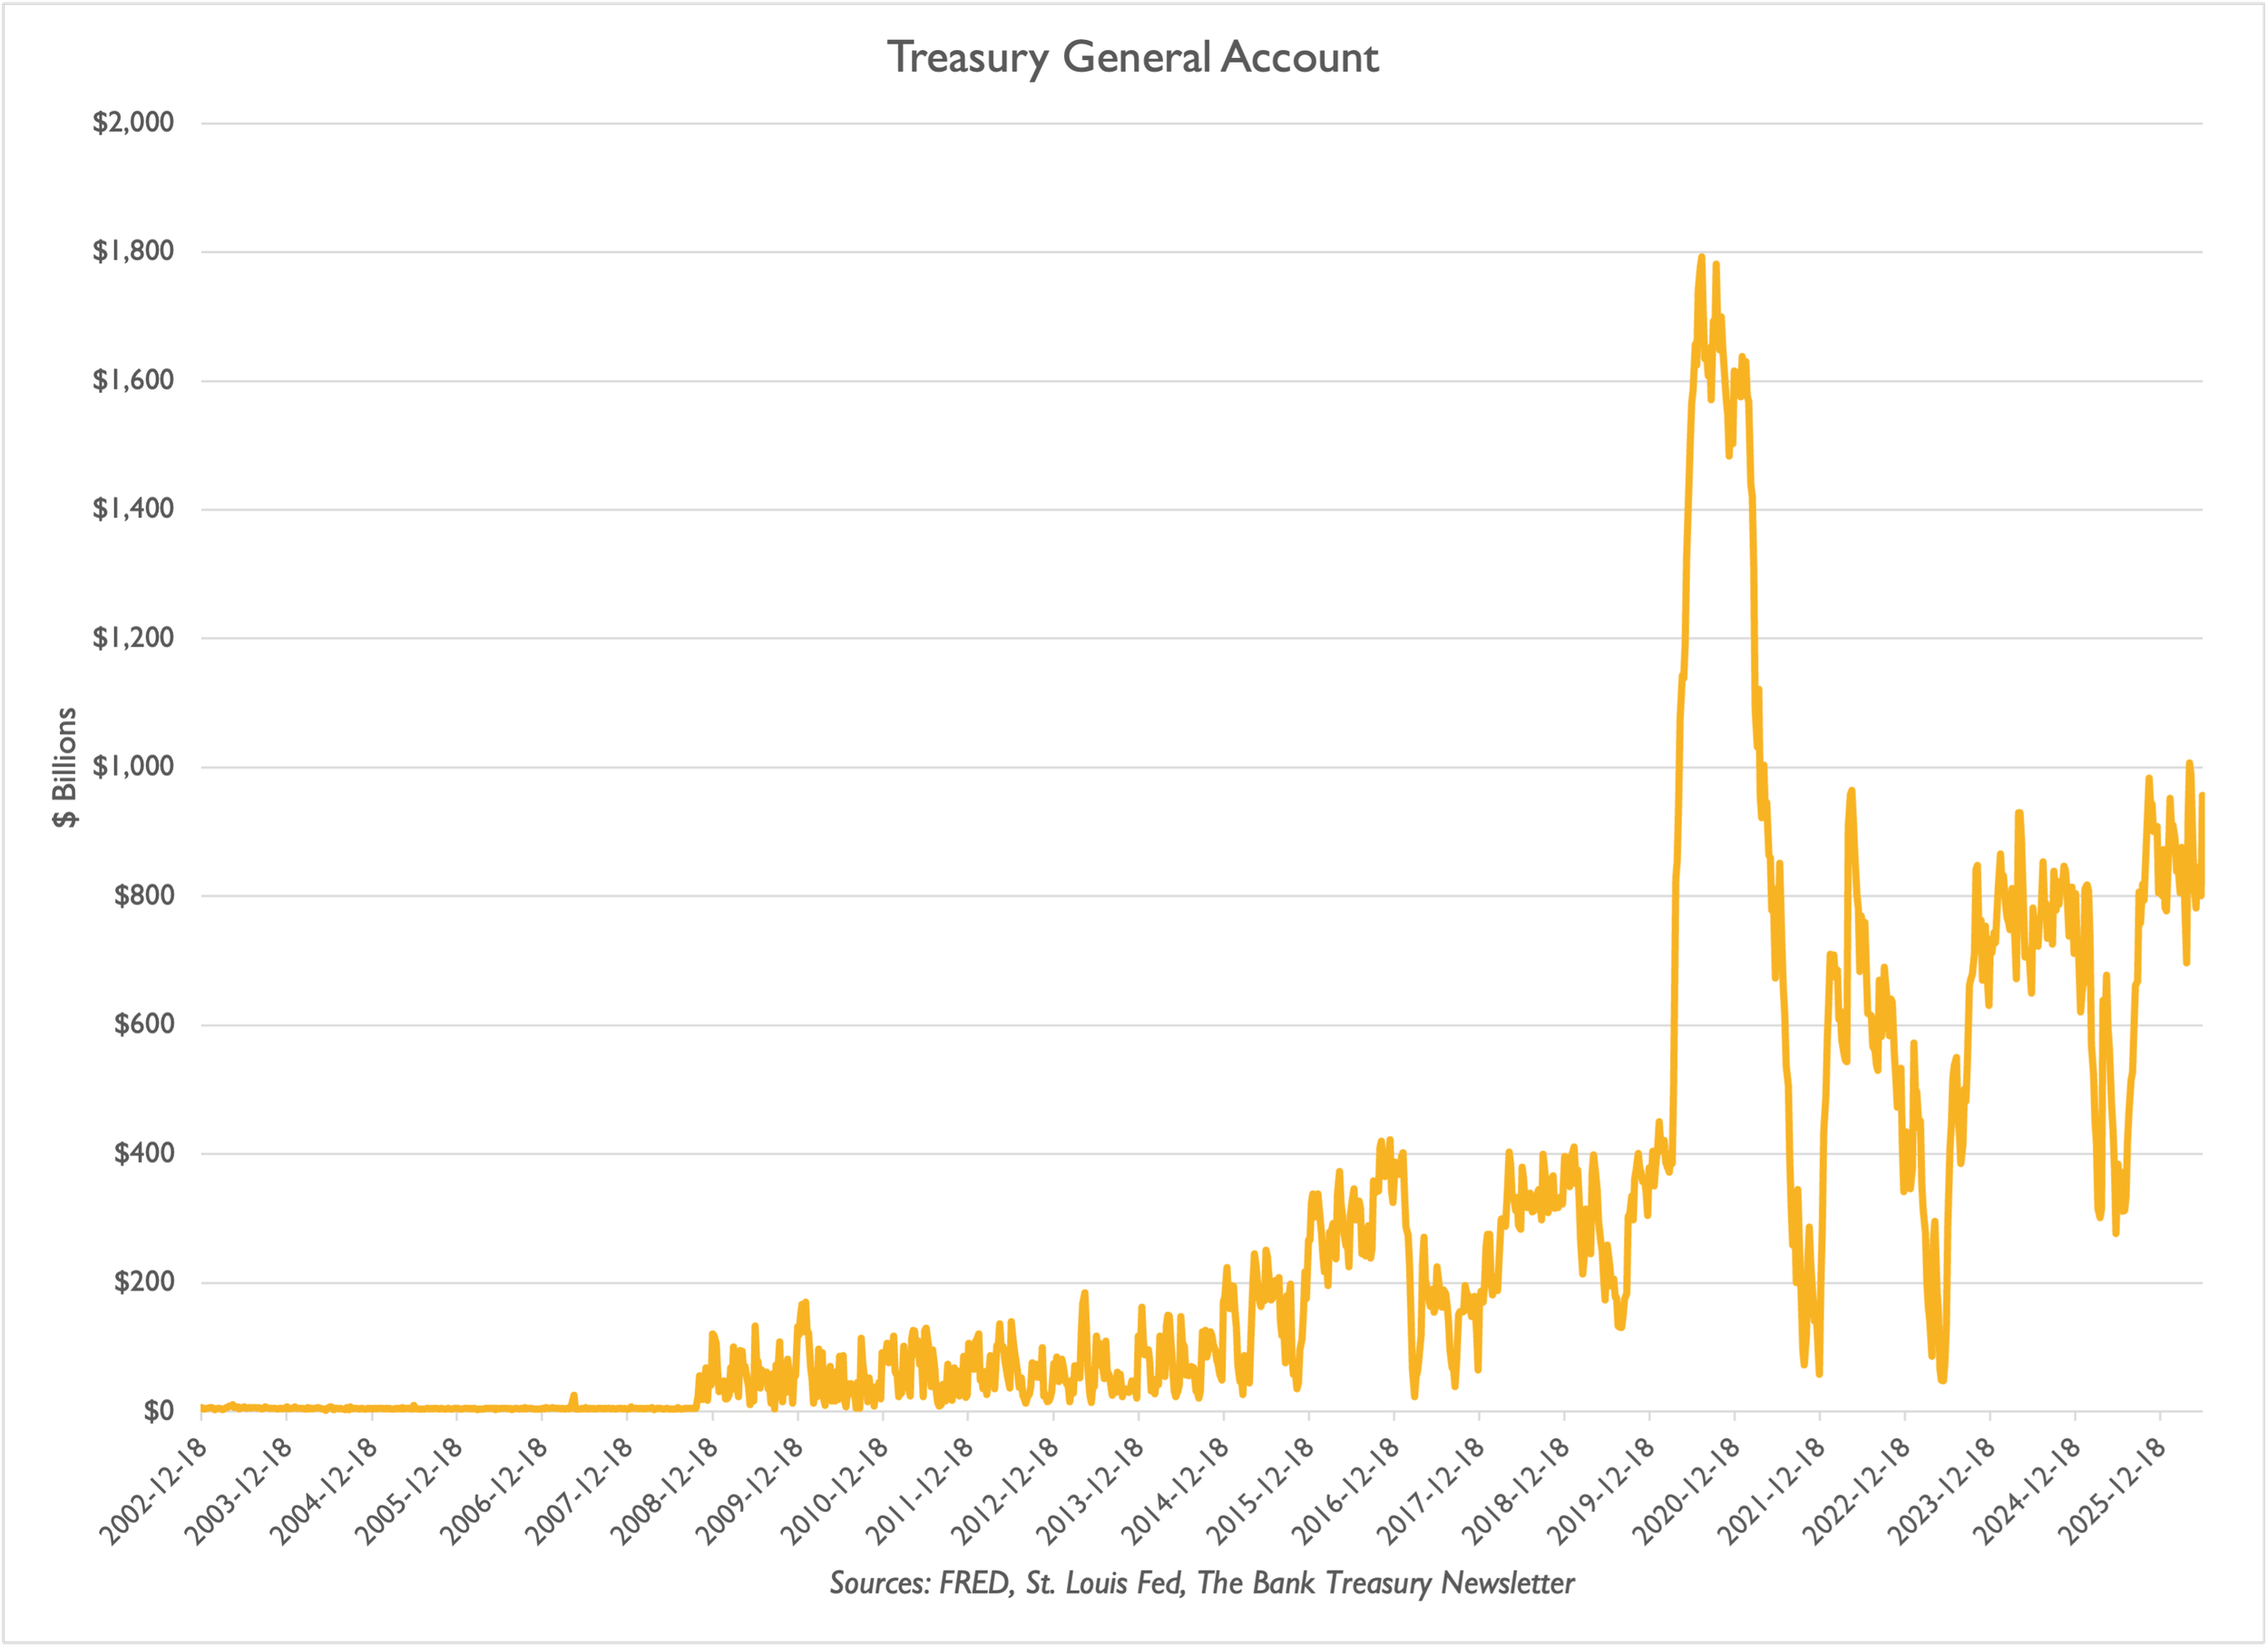
TGA Drives the Fed’s Balance Sheet Higher
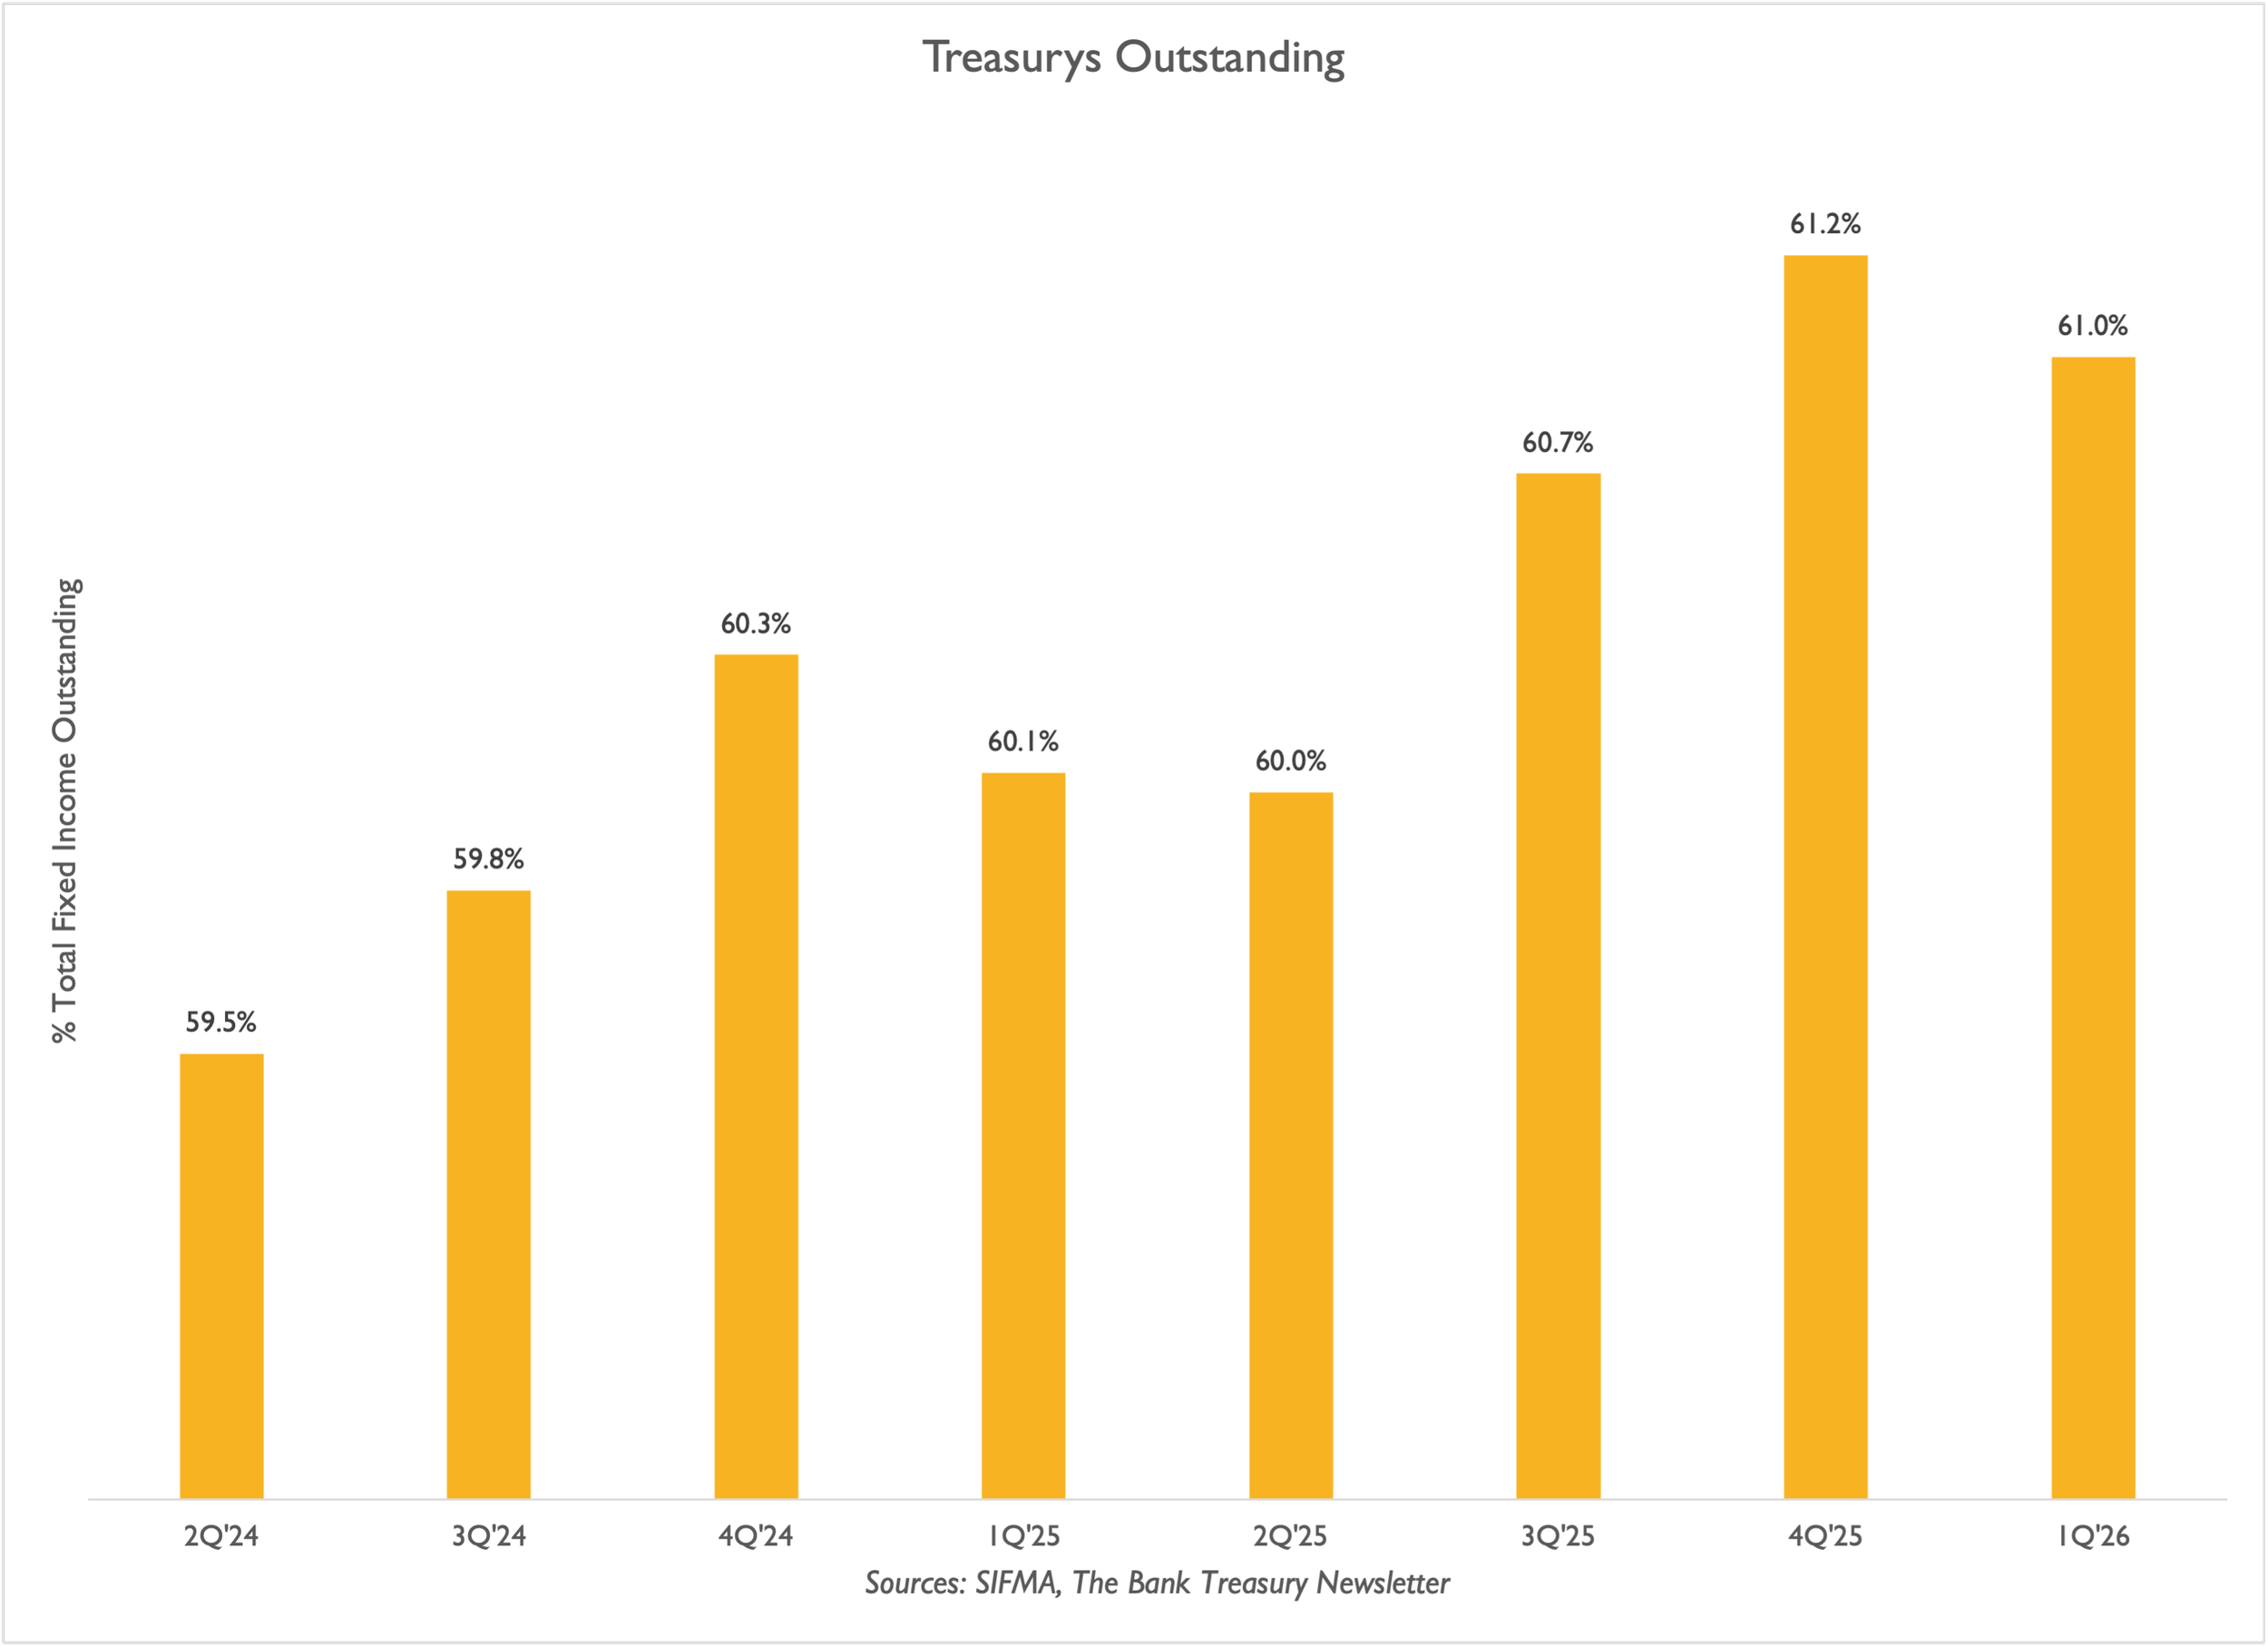
Treasury Debt Crowding Out Other Debt
High-Grade Debt Issuance Tops $1 Trillion YTD

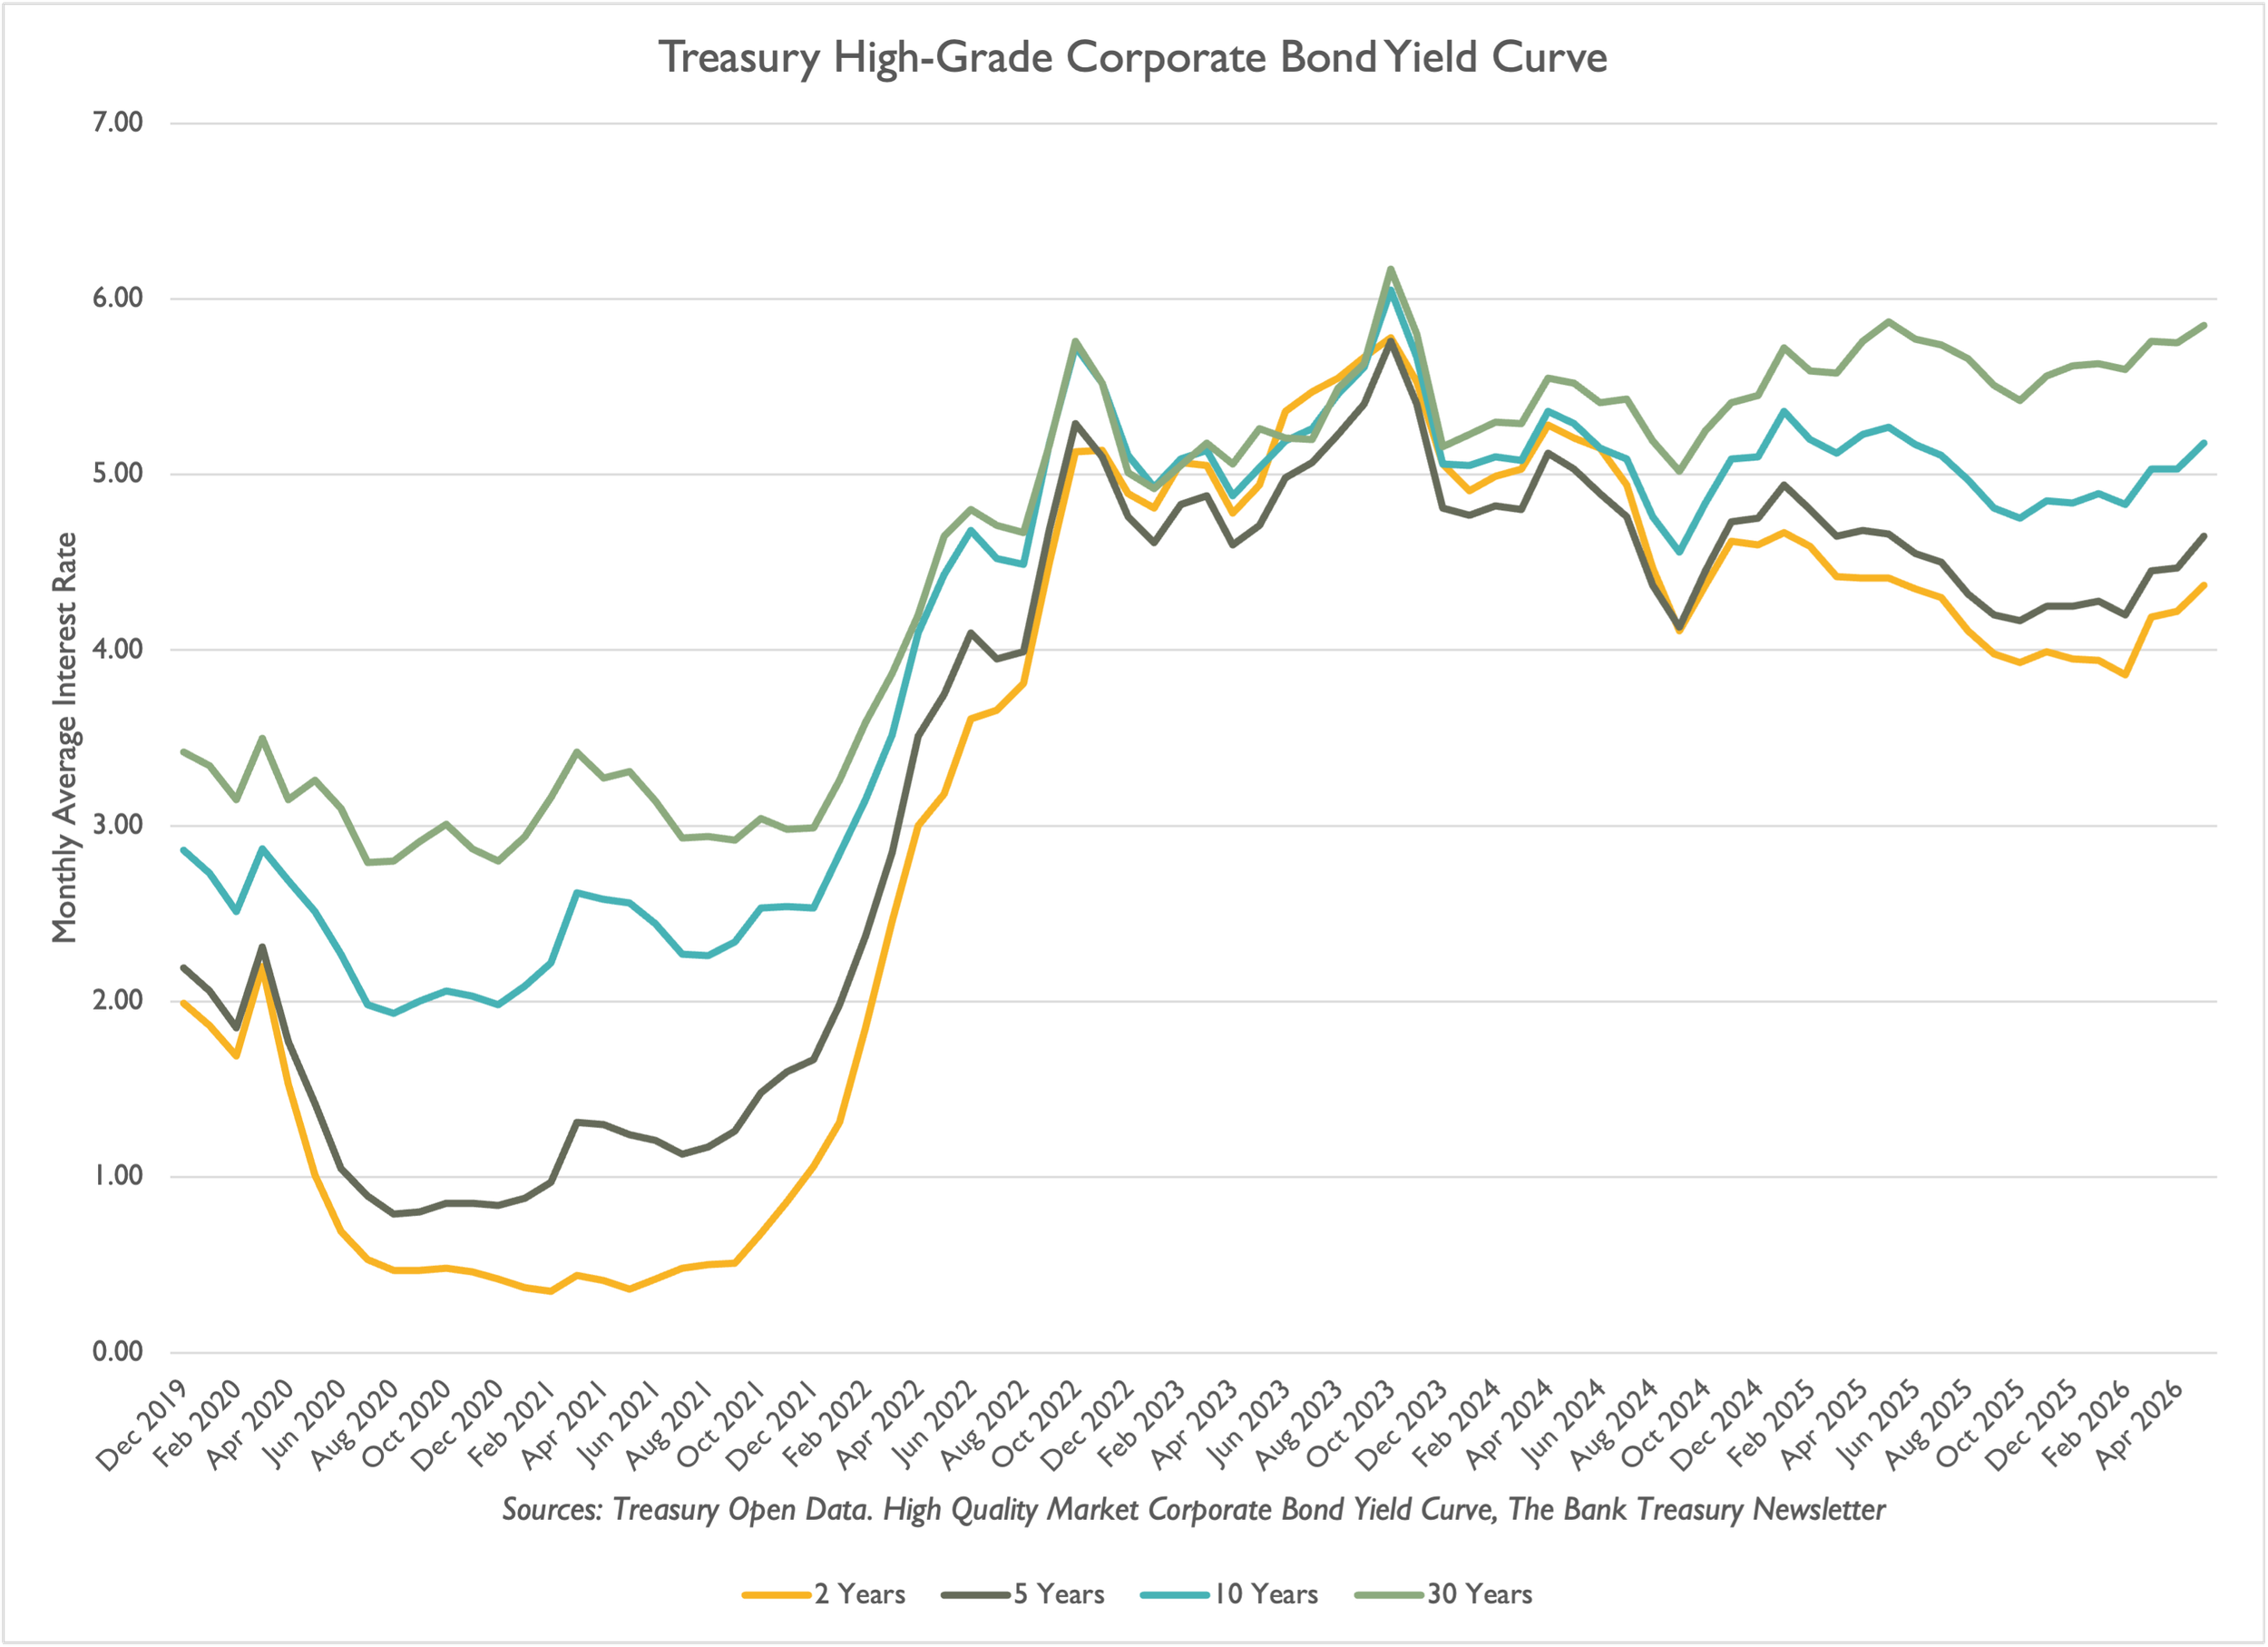
Corporate Bond Yield Curve Steepens
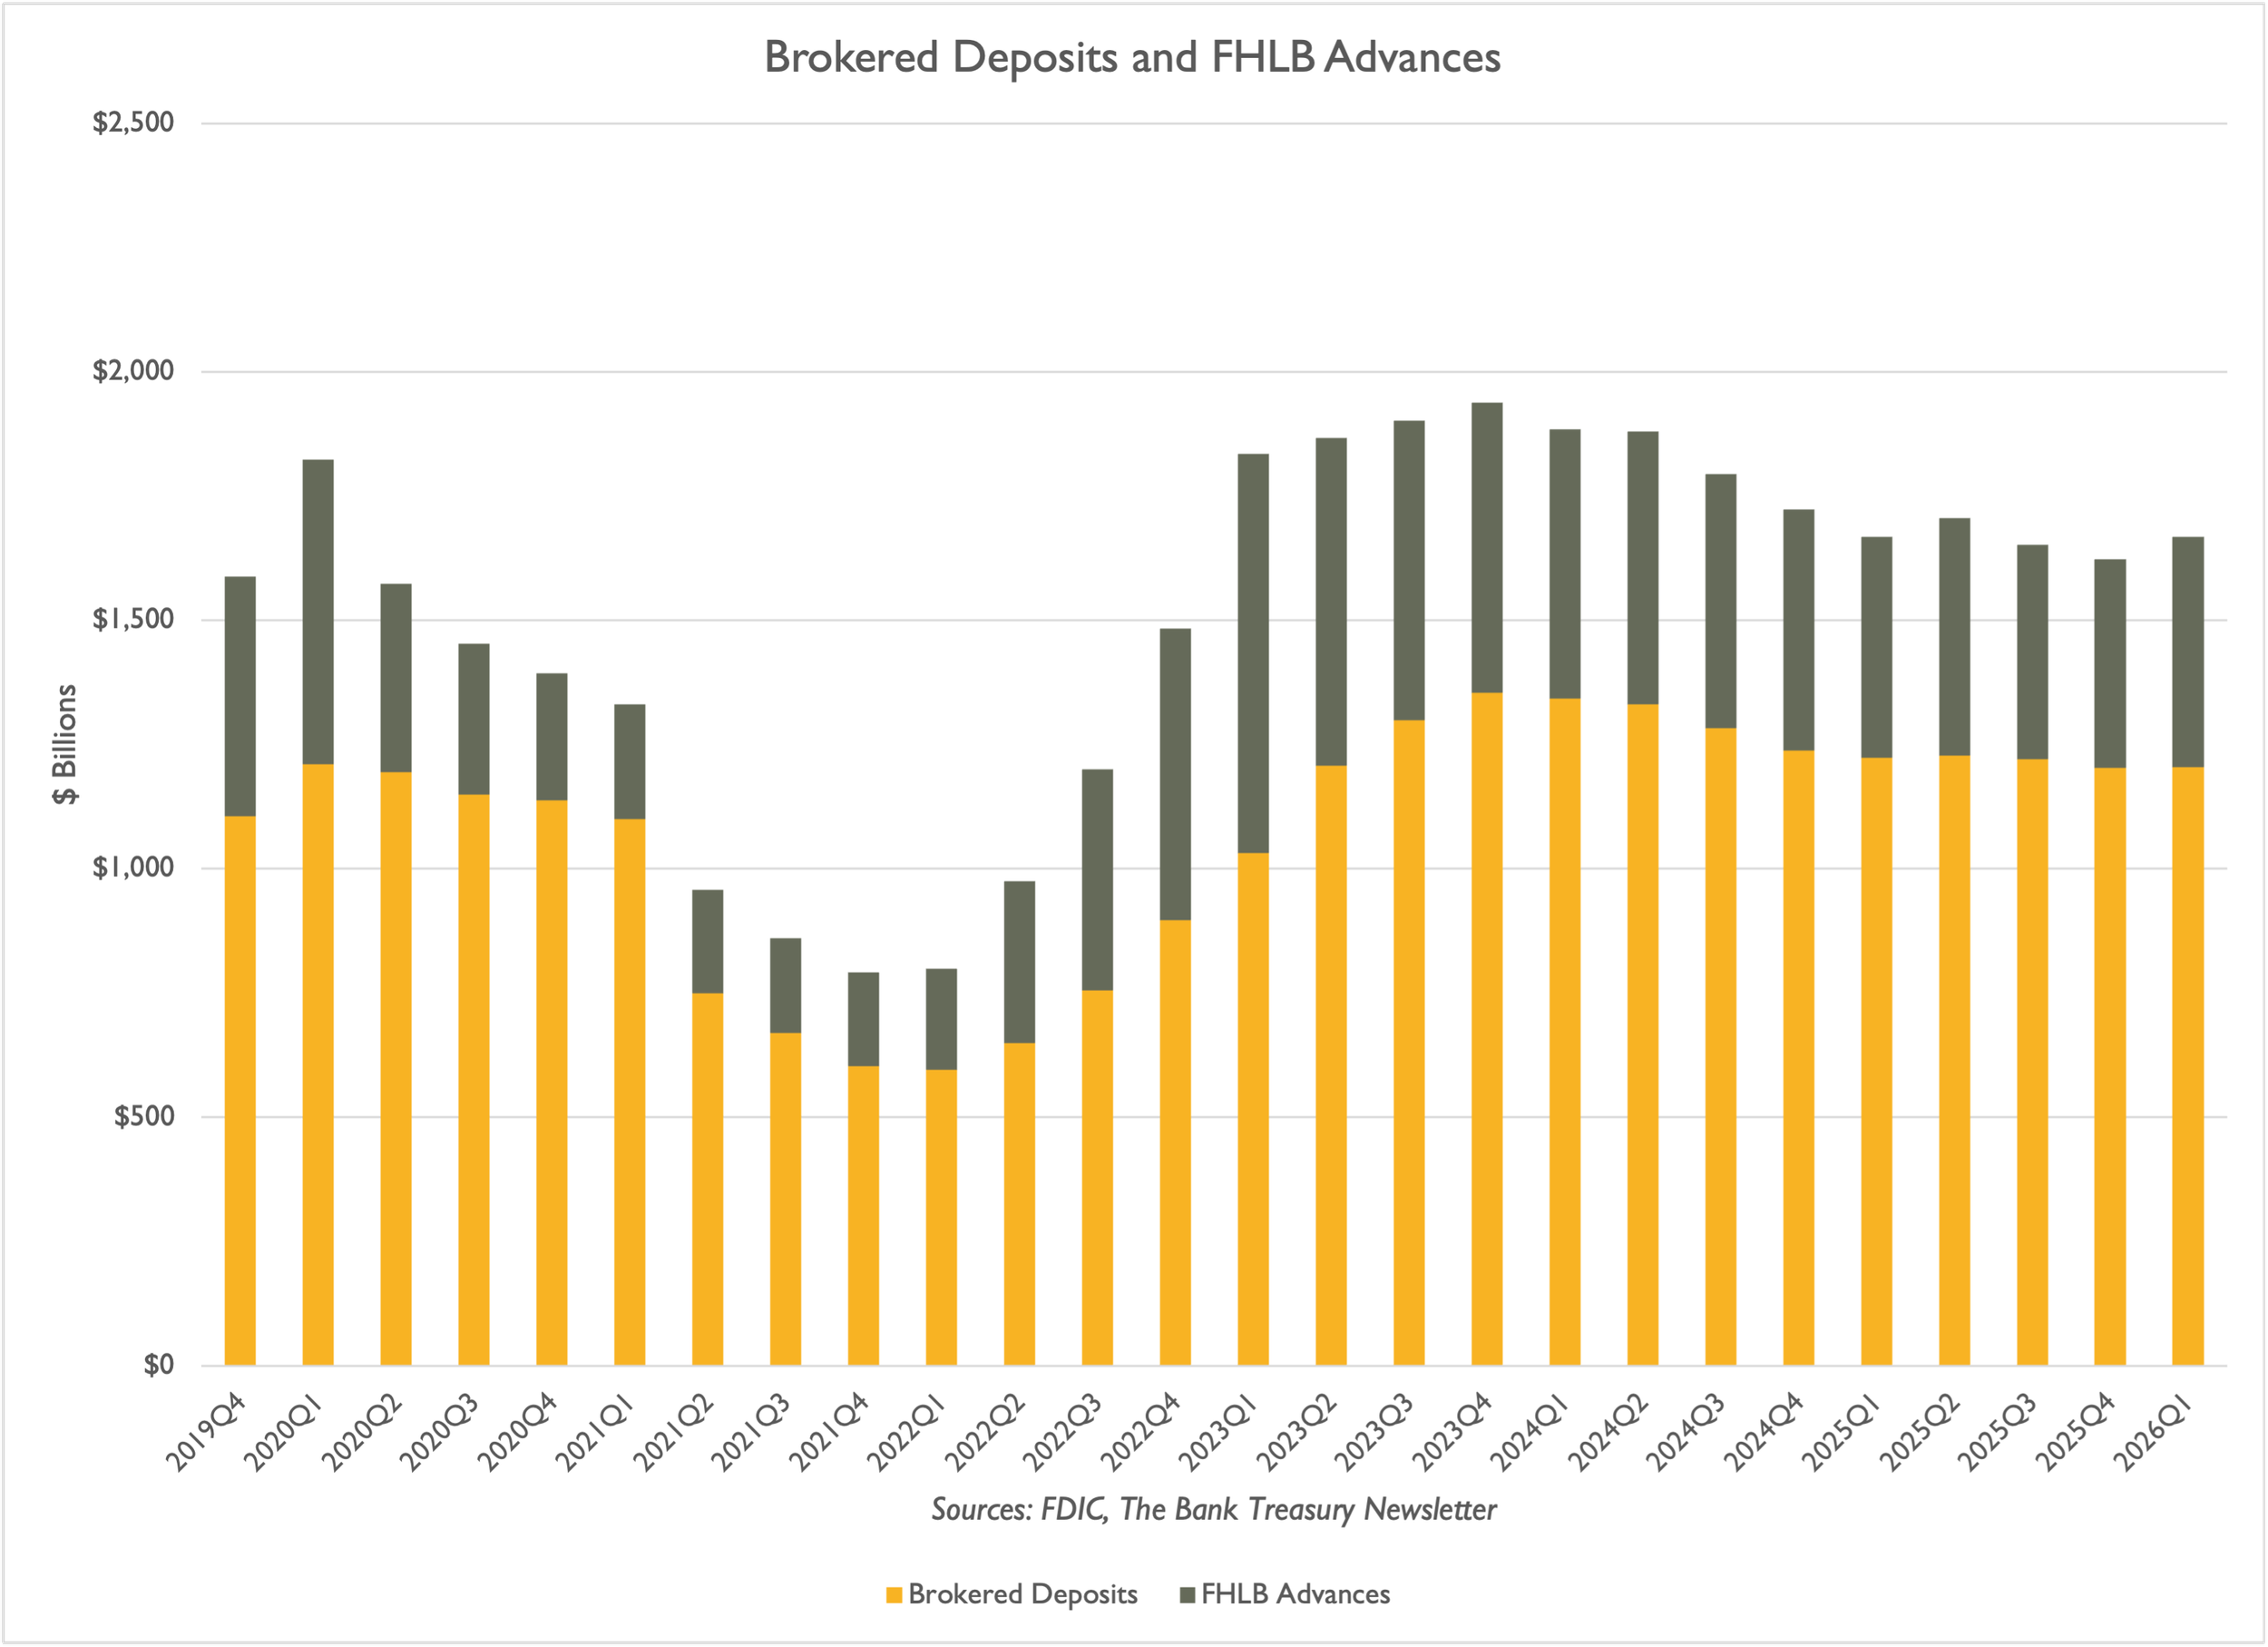
Brokered CDs Roll Off, FHLB Advances Roll On

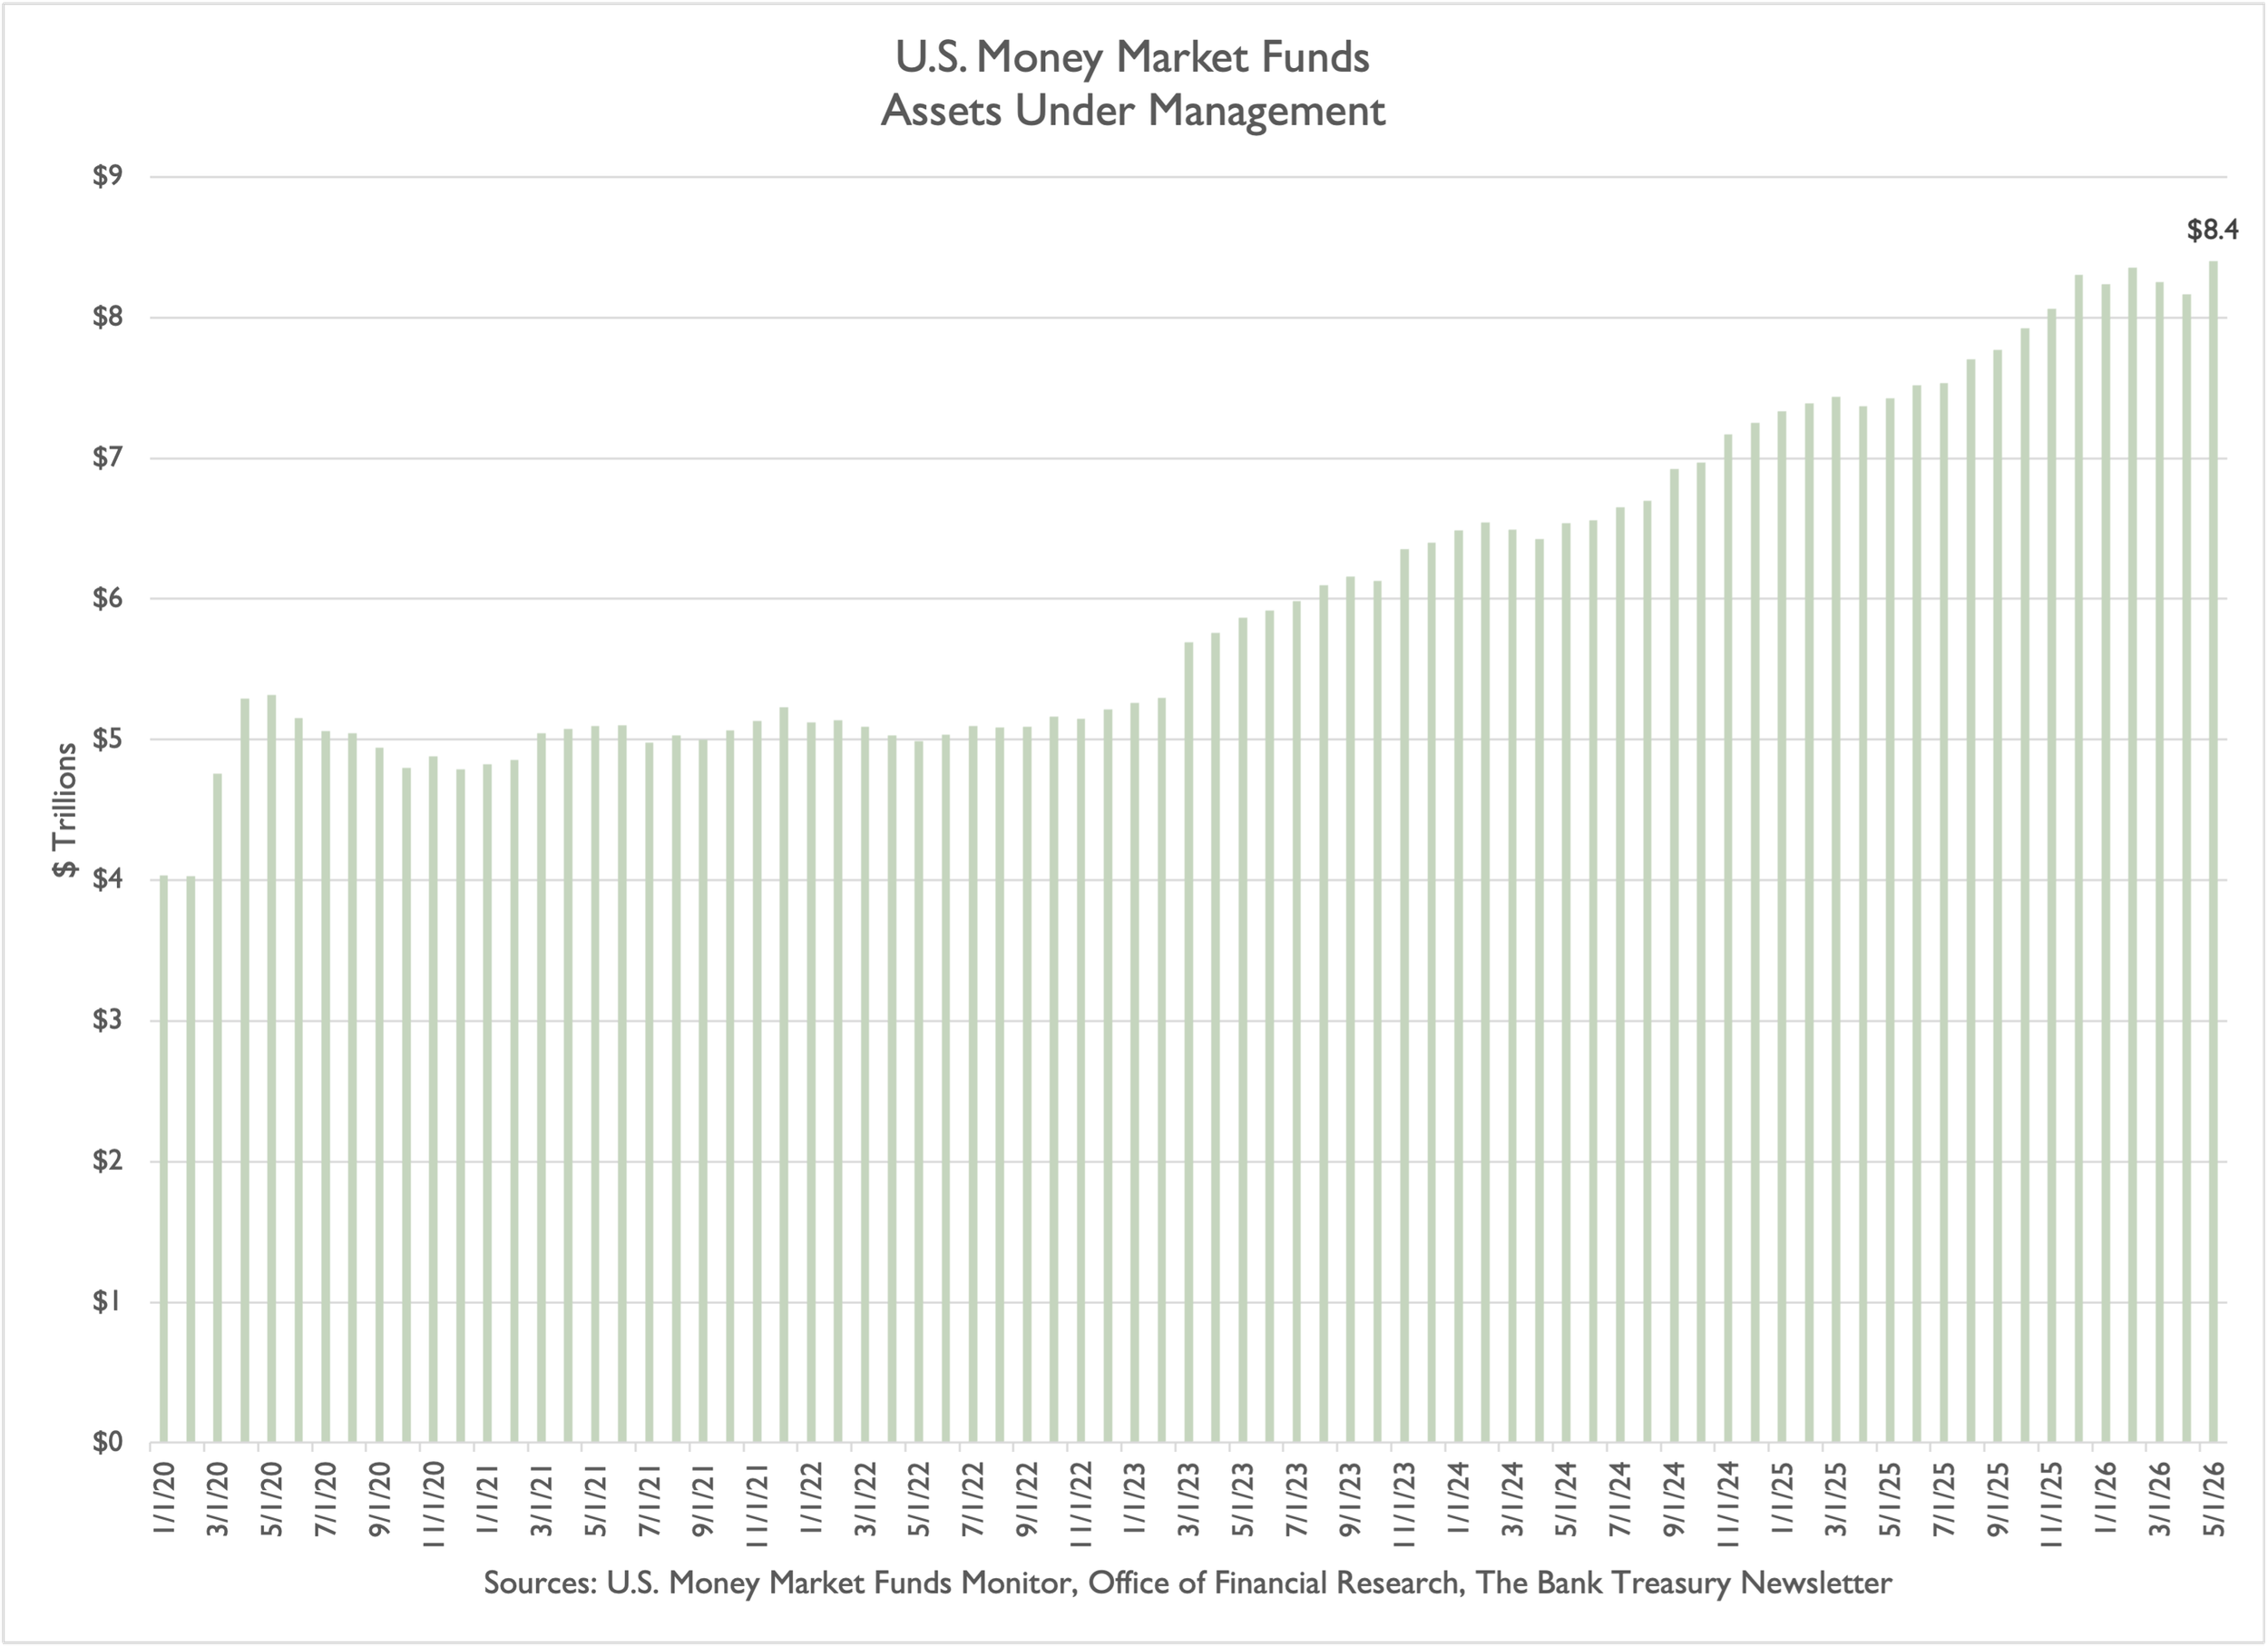
Money Market Funds Reach New Heights


The Bank Treasury Newsletter is an independent publication that welcomes comments, suggestions, and constructive criticisms from our readers in lieu of payment. Please refer this letter to members of your staff or your peers who would benefit from receiving it, and if you haven’t yet, subscribe here.
Copyright 2026, The Bank Treasury Newsletter, All Rights Reserved.
Ethan M. Heisler, CFA
Editor-in-Chief