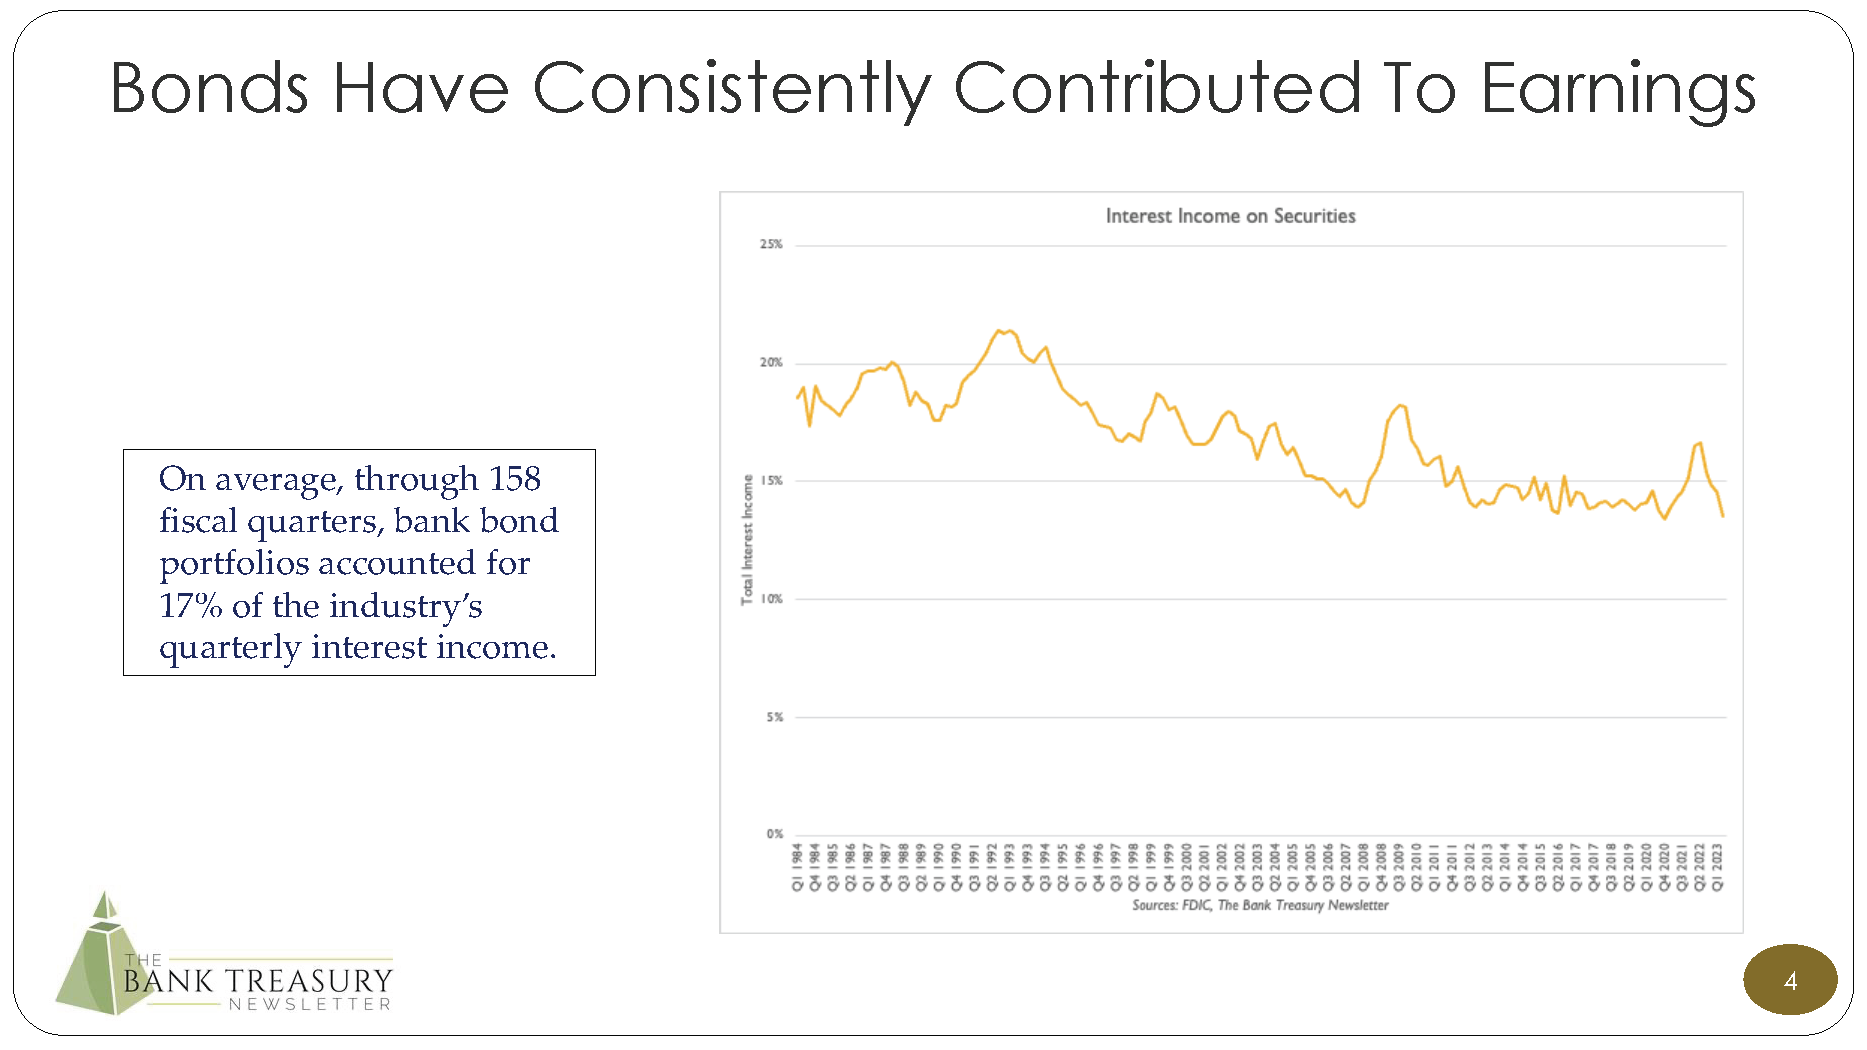
But setting that aside, we cannot imagine the pain bank treasurers must feel when they kick themselves for buying the underwater bonds sitting on their balance sheet. What were they thinking in 2020 and 2021 buying what will probably turn out to be the lowest coupon bonds they ever bought in their career and expecting everything would be fine booking these bonds in HTM and sheltering them from mark-to-market? Or buying them in the first place. The thing is, though, as discussed in this month’s newsletter, buying bonds was the right choice. Drawing on the latest FDIC data going back to Q1 1984—so for 158 quarters—the aggregate bonds held by the industry (invested primarily in Agency MBS by the way) generated cumulative interest income equal to $3.2 trillion. If the same principal had been invested in a portfolio of 3-month T-Bills and rolled for 158 quarters, cumulative interest income would have amounted to $1.9 trillion. A considerable underperformance. And yet, in the short-term, bonds underperformed T-Bills in each of the last four quarters, and underwater bond portfolios at the three big banks that failed are costing the FDIC billions and billions.
Asset-liability management, liquidity management, contingency funding, and interest rate risk management. These are the keywords for bank treasurers. But as the FDIC admitted in its report on the failure of FRB that it released this month, FRB’s management was A+, at least by the standard metrics of interest rate risk and liquidity management. Even its large dependence on uninsured deposit funding did not look as risky as it suddenly looks now. So, as far as regulators are concerned, a lot of standard assumptions about what defines “safety and soundness” are up for some hard reexamination. Bank treasurers are going to be expected not only to hold a shorter bond portfolio and more cash, but to demonstrate why the mix of bonds and cash they plan to hold will be sufficient to weather whatever comes in the new world of one-day bank runs. A tall order when they do not know which way rates are headed.
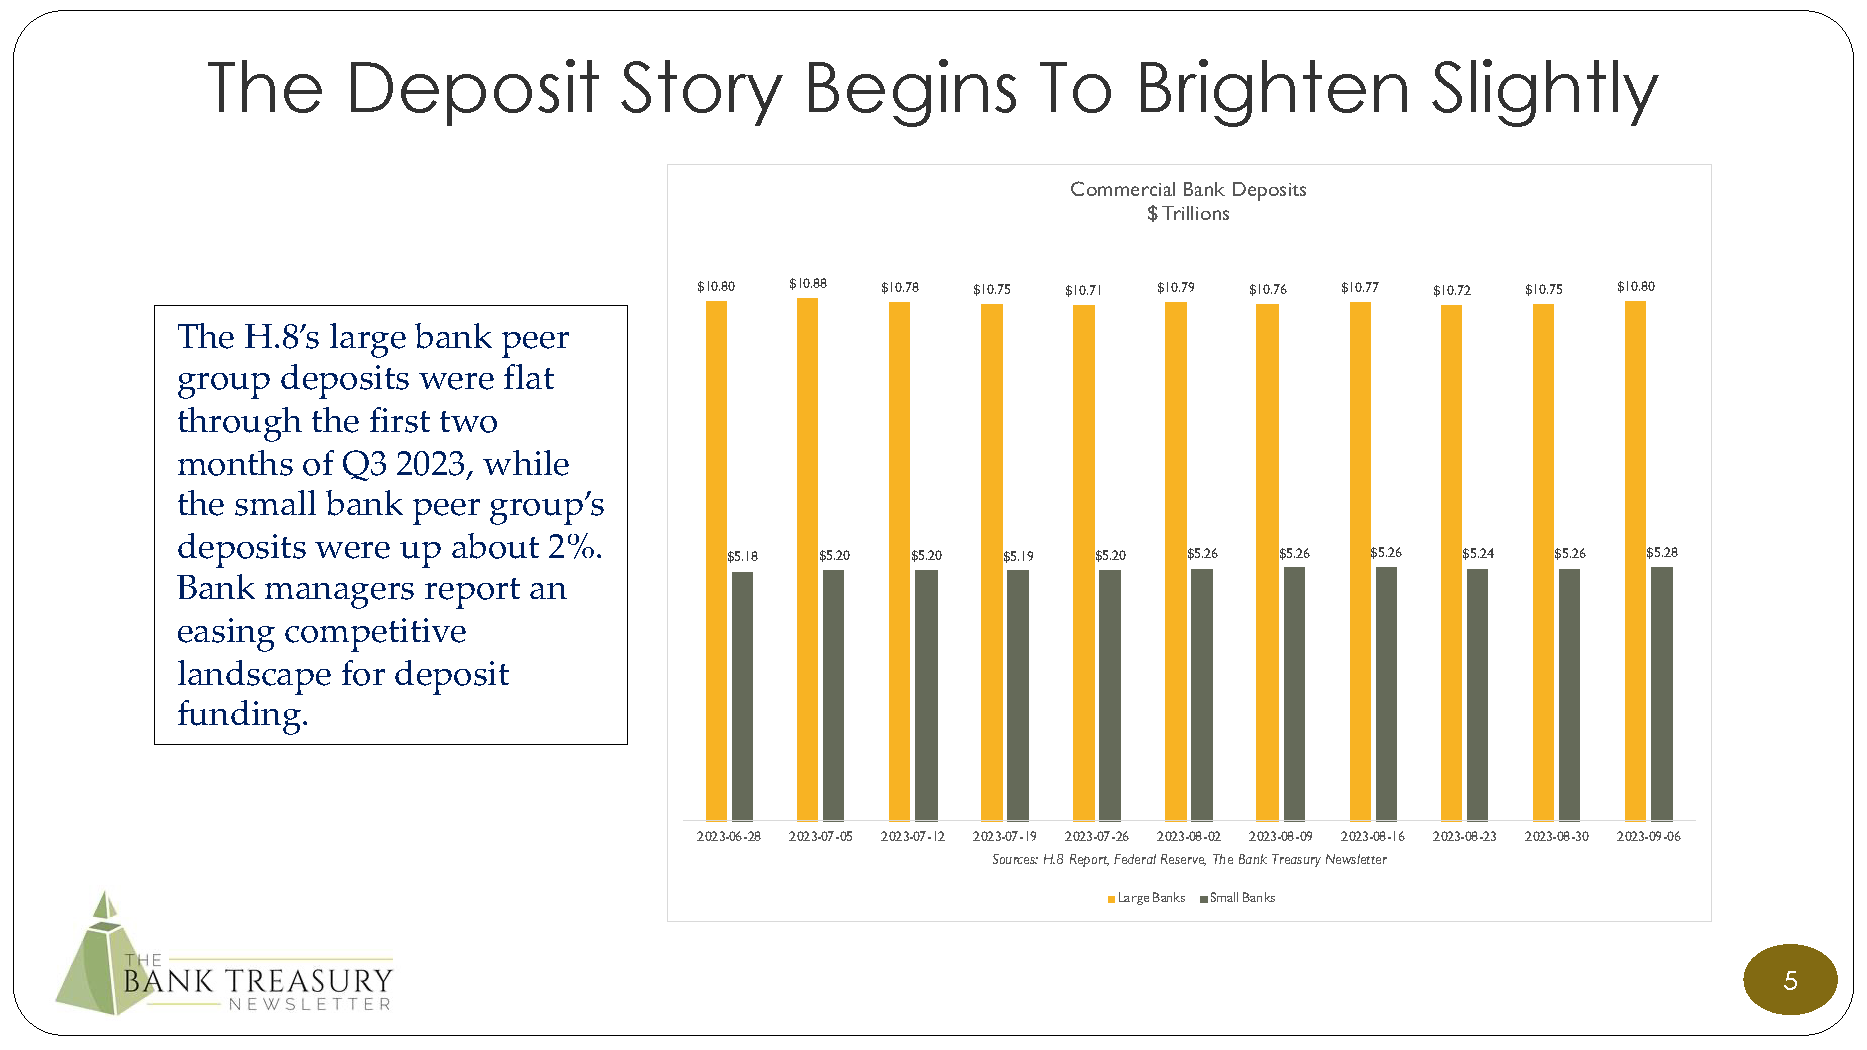
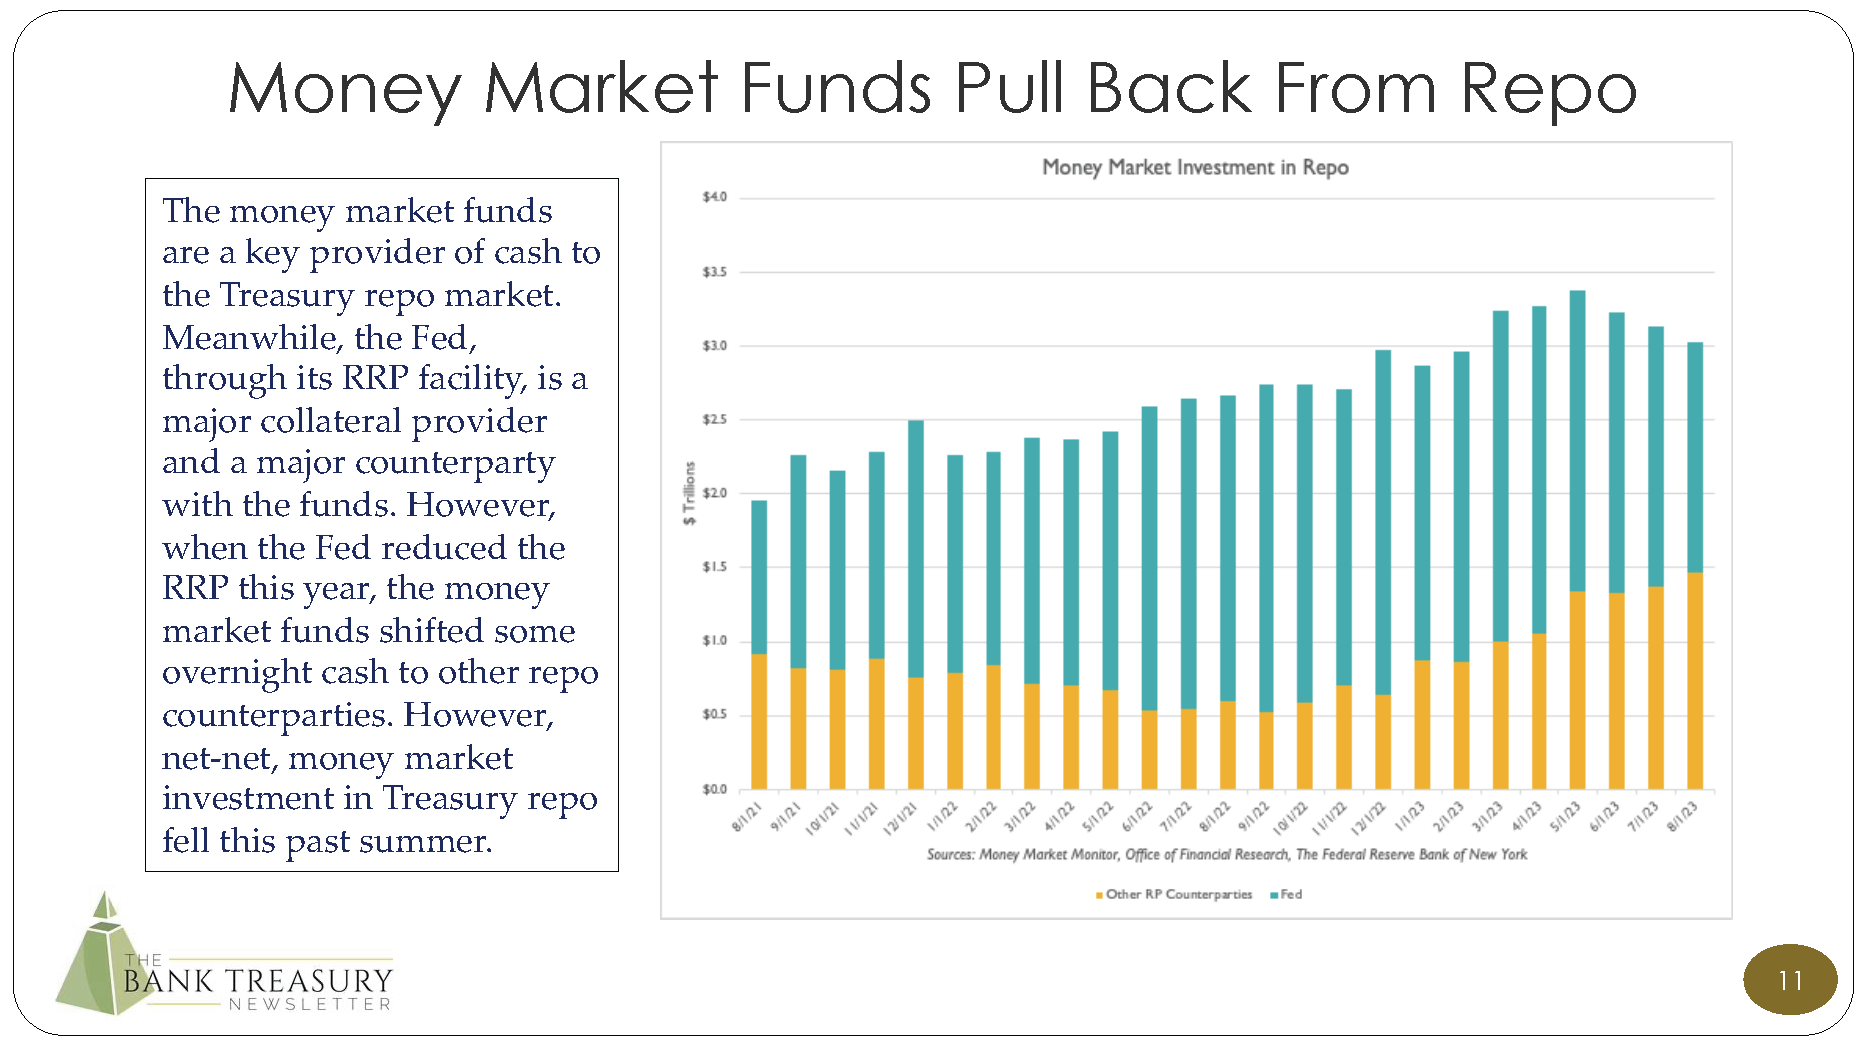
The main message to the markets going into next month’s earning season is that deposit outflows are cresting or crested. This month’s chart deck in fact finds that that deposits for the Fed H.8’s small bank peer group increased a smidgen since the end of June, a notable turnaround considering the outflows that regional banks suffered after the failure of SVB last March. The outflows that did not go into the large bank peer group went to the money market funds, which is why the second half of the chart deck looks at developments with the funds and their investment in the Treasury repo market.
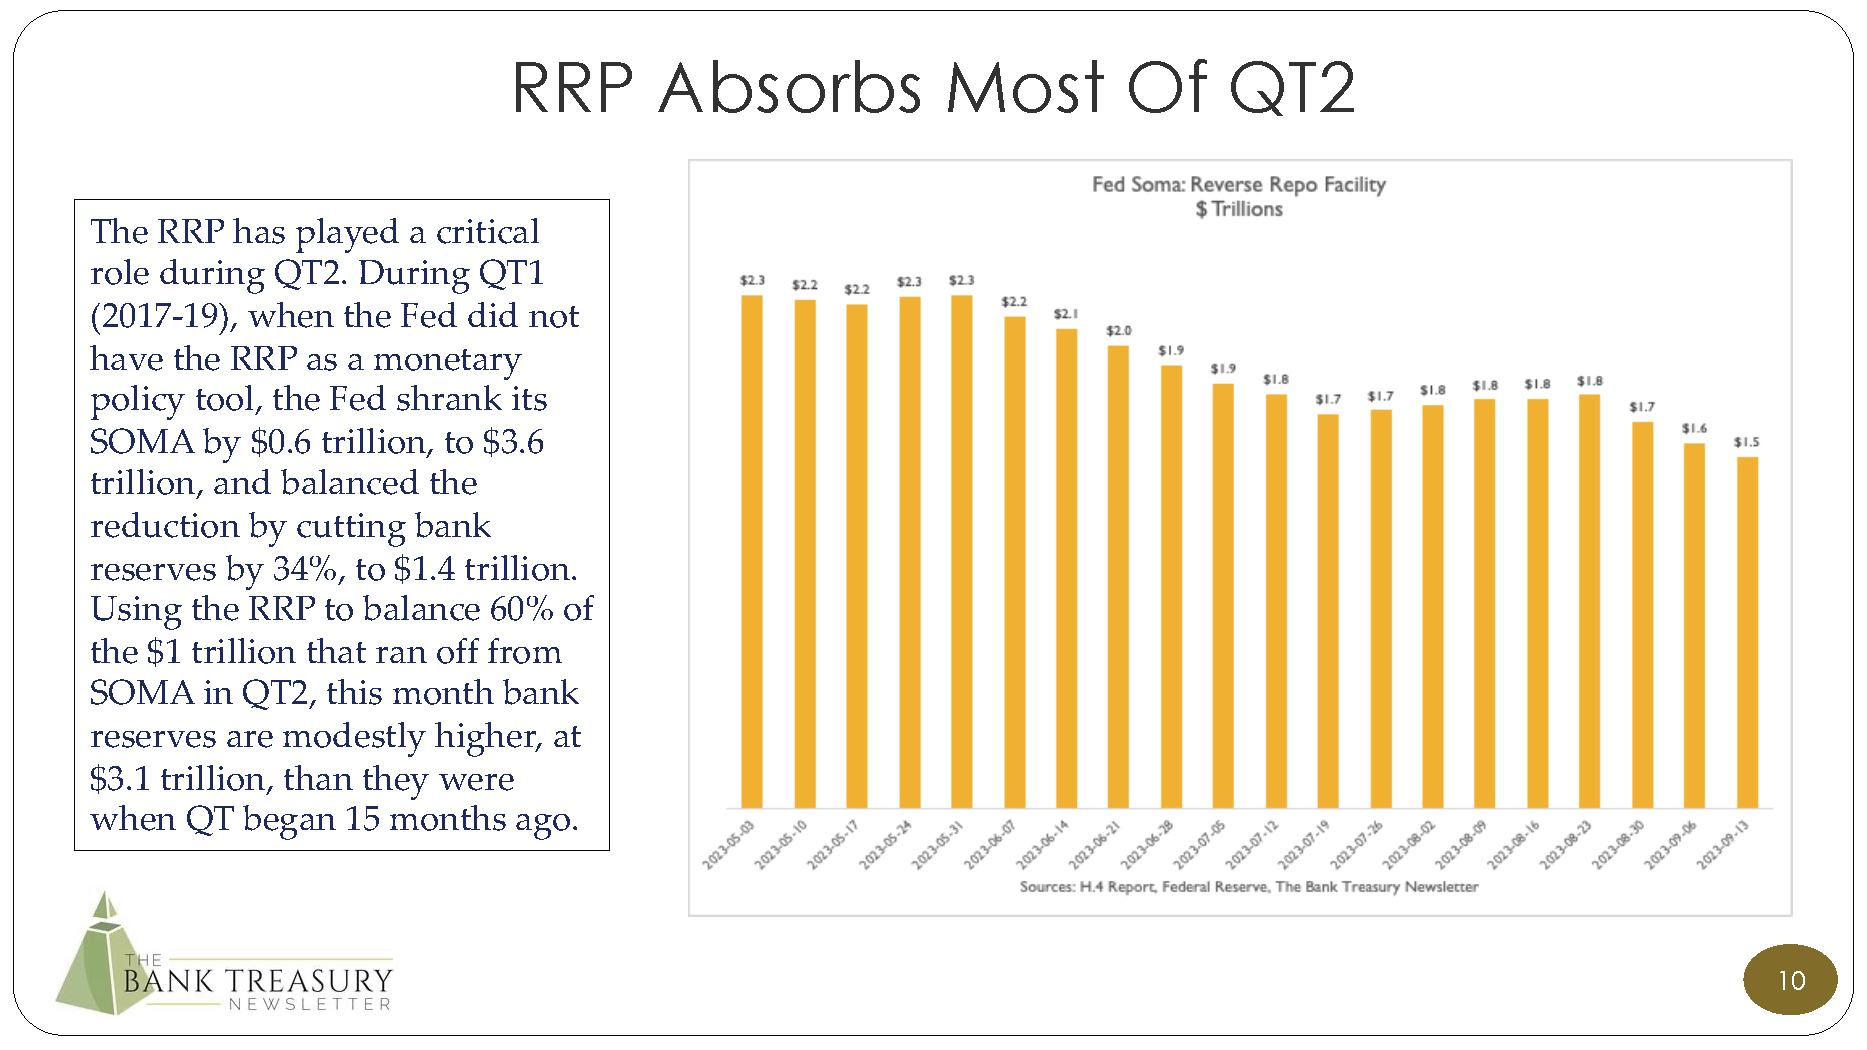
As the Fed reduced its RRP from $2.1 trillion to under $1.5 trillion, the funds shifted some of their investment that had gone into the Fed’s RRP to other repo counterparties, but the data from May through the end of August shows that their total investment in the Treasury repo market fell from a peak of $3.4 trillion to $3.0 trillion. So, net-net, cash is leaving the repo market, which might be a tad inconvenient as the Treasury’s $1 trillion-plus refunding plans proceed apace. Memories of past meltdowns in the repo market still keep bank treasurers up at night, like that time back in September 2019, when overnight repo shot up to 5.25% from under 2% in a day.
As usual, just a lot of stuff going on in the bank treasury space and time to cover it, much less for our busy readers to read all about it, is limited. But as always, your comments and suggestions are most welcome. Please visit our new and improved website (www.thebanktreasurynewsletter.com), completely redesigned and ready for a bookmark in your browser. The website is an archive for the current and previous newsletters and chart decks but stay tuned for announcements starting next month on podcast interviews your editor-in-chief will host with leading thought leaders in the bank treasury space.


![The+Bank+Treasury+Newsletter+September+2023[77]_Page_01.png](https://images.squarespace-cdn.com/content/v1/64fba1090e18127fa361f051/1697058010689-AXTZU8INAL5AKZ24MO37/The%2BBank%2BTreasury%2BNewsletter%2BSeptember%2B2023%5B77%5D_Page_01.png)
![The+Bank+Treasury+Newsletter+September+2023[77]_Page_02.png](https://images.squarespace-cdn.com/content/v1/64fba1090e18127fa361f051/1697058011001-SY6KC9WG8WG56PDON8R4/The%2BBank%2BTreasury%2BNewsletter%2BSeptember%2B2023%5B77%5D_Page_02.png)
![The+Bank+Treasury+Newsletter+September+2023[77]_Page_03.png](https://images.squarespace-cdn.com/content/v1/64fba1090e18127fa361f051/1697058011603-VWO5MYC6VJP370HCKO6C/The%2BBank%2BTreasury%2BNewsletter%2BSeptember%2B2023%5B77%5D_Page_03.png)
![The+Bank+Treasury+Newsletter+September+2023[77]_Page_04.png](https://images.squarespace-cdn.com/content/v1/64fba1090e18127fa361f051/1697058011859-FFHISC985BGMLTBWC3RL/The%2BBank%2BTreasury%2BNewsletter%2BSeptember%2B2023%5B77%5D_Page_04.png)
![The+Bank+Treasury+Newsletter+September+2023[77]_Page_05.png](https://images.squarespace-cdn.com/content/v1/64fba1090e18127fa361f051/1697058012576-XRI9YY01NI0NCK1SMCAE/The%2BBank%2BTreasury%2BNewsletter%2BSeptember%2B2023%5B77%5D_Page_05.png)
![The+Bank+Treasury+Newsletter+September+2023[77]_Page_06.png](https://images.squarespace-cdn.com/content/v1/64fba1090e18127fa361f051/1697058012836-CZR24Z8WDXXES05SUR62/The%2BBank%2BTreasury%2BNewsletter%2BSeptember%2B2023%5B77%5D_Page_06.png)
![The+Bank+Treasury+Newsletter+September+2023[77]_Page_07.png](https://images.squarespace-cdn.com/content/v1/64fba1090e18127fa361f051/1697058013578-PKIU3ZR1K51R3300Q7Y9/The%2BBank%2BTreasury%2BNewsletter%2BSeptember%2B2023%5B77%5D_Page_07.png)
![The+Bank+Treasury+Newsletter+September+2023[77]_Page_08.png](https://images.squarespace-cdn.com/content/v1/64fba1090e18127fa361f051/1697058013831-PKWKA0G57AU7V8FZ300X/The%2BBank%2BTreasury%2BNewsletter%2BSeptember%2B2023%5B77%5D_Page_08.png)
![The+Bank+Treasury+Newsletter+September+2023[77]_Page_09.png](https://images.squarespace-cdn.com/content/v1/64fba1090e18127fa361f051/1697058014371-2NE1IG4AH8ZJJG9OHJUS/The%2BBank%2BTreasury%2BNewsletter%2BSeptember%2B2023%5B77%5D_Page_09.png)
![The+Bank+Treasury+Newsletter+September+2023[77]_Page_10.png](https://images.squarespace-cdn.com/content/v1/64fba1090e18127fa361f051/1697058014860-YOT0LALVYJA0I88KPZI2/The%2BBank%2BTreasury%2BNewsletter%2BSeptember%2B2023%5B77%5D_Page_10.png)
![The+Bank+Treasury+Newsletter+September+2023[77]_Page_11.png](https://images.squarespace-cdn.com/content/v1/64fba1090e18127fa361f051/1697058015344-YUZKGY1K8IJ5ZUG1N3QO/The%2BBank%2BTreasury%2BNewsletter%2BSeptember%2B2023%5B77%5D_Page_11.png)
![The+Bank+Treasury+Newsletter+September+2023[77]_Page_12.png](https://images.squarespace-cdn.com/content/v1/64fba1090e18127fa361f051/1697058016065-LWK39F4VM5DOZV5UIXTA/The%2BBank%2BTreasury%2BNewsletter%2BSeptember%2B2023%5B77%5D_Page_12.png)
![The+Bank+Treasury+Newsletter+September+2023[77]_Page_13.png](https://images.squarespace-cdn.com/content/v1/64fba1090e18127fa361f051/1697058016335-U76WCS3GDC9U8WBIEQJ7/The%2BBank%2BTreasury%2BNewsletter%2BSeptember%2B2023%5B77%5D_Page_13.png)