

BANK TREASURERS REMEMBER MARTY LEIBOWITZ
Kevin Warsh became the 17th head of the Federal Reserve since its establishment in 1914. This month, he chaired his first Federal Open Market Committee (FOMC) meeting, where he voted with the other members to maintain the current target for the Fed funds rate and the size of the Fed’s balance sheet, which stands at over $6.7 trillion. He has promised to bring a new approach to the Fed’s conduct of monetary policy, to be less communicative with the public, and the FOMC’s short policy statement following the meeting reflected this philosophy. He also wants to eliminate the Fed’s dot plot projections to stop telling the market what the Fed thinks and to let markets work out where rates should head without signals from the Fed. Pointedly, his dot was the only one not included in the dot plot the Fed released this month.
He also favors a smaller Fed balance sheet and, this month, commissioned a task force to pursue that as a Fed objective. Its members will need to find ways to reduce banks’ demand for reserve deposits. More than a third of reserves on the Fed’s balance sheet are supplied by foreign branches and agencies, which are not covered by FDIC insurance and can therefore take advantage of this exemption to arbitrage the rate the Fed pays on their deposits against the rate they pay for funds in the Eurodollar market. Aside from their value as a source of liquidity for financial institutions, reserve deposits are the lifeblood of the payment system over FedWire, with the $3 trillion in reserves outstanding supporting annual payment volumes that exceeded $1.1 quadrillion last year and a daily volume of $4.6 trillion. These numbers have doubled since Kevin Warsh originally resigned his seat as a Fed Governor in 2011.
His fans believe he could become one of the Fed’s most influential leaders, in the mold of the late Alan Greenspan, who passed away this month at the age of 100. Indeed, he may have a chance to influence the composition of the FOMC, starting with the selection of the next president of the Atlanta Fed, a position vacant since last February. Meanwhile, his first test is already here as inflation worries heat up, with the latest CPI and PPI readings reflecting higher costs as fallout from the U.S. war with Iran. Market participants, not needing dot plots to tell them where the Fed funds rate target is headed, continued to lead the bear flattening at the front end of the yield curve. The yield on a 2-year Treasury note is up 10-20 basis points since June 1st to 4.1%-4.2%, and is up from 3.35% since the war began on February 28th. The spread between the Fed’s interest on reserve balances (IORB) and the 2-year rate is over 50 basis points this month, compared with 35 basis points last month, and was inverted by 15 basis points when markets opened in the new year. Notably, the latest sell-off in energy prices toward the end of last week led to a slight flattening of the front end, suggesting the market believes the worst of the inflationary threats to the economy is past. This assumption remains to be seen in what remains a volatile and uncertain situation.
The prospect of a hawkish Fed did nothing to dampen expectations in the bank treasury world for solid loan demand this year, which would add to the strong production bank treasurers have already seen since the new year. Loans have grown by $400 billion since December 2025, to a record $13.8 trillion this month. Deposits have grown as well, and at over $19 trillion, they are $1 trillion above the previous peak set four years ago. As customer deposits grew, the latest FDIC data show that banks let about 2% of the balance of their brokered deposits ($25 billion) run off, reducing the total to $1.2 trillion, while they increased their FHLB advances from $419 billion to $463 billion. Deposit growth coincided with higher balances in the public’s holdings of money market funds, which have increased by $100 billion since the new year to $8.4 trillion.
And the good news does not stop there. Bank treasurers are optimistic that over the next couple of years they will see the end of their long nightmare with negative Accumulated Other Comprehensive Income (AOCI). The fair value of the industry’s aggregate available-for-sale securities was less than negative 3% of amortized cost at the end of Q1 2026, compared with minus 10% following the failure of Silicon Valley Bank in Q1 2023. Regulatory reforms that roll back rules bank managers have long complained hamper the banking industry’s competitive standing with its nonbank peers are also welcome news in bank treasury circles. Bank supervisors, for example, formally proposed last month to revise their methodology for their CAMELS ratings (Capital, Asset quality, Management, Earnings, Liquidity, and market Sensitivity) to reduce the weight of the management assessment in the composite rating.
On the other hand, bank treasurers remain wary of the legislative push to support the digital asset market, including crypto and stablecoins. This month, for example, the U.S. Senate agreed to add the Clarity Act to its calendar for a vote, almost a year after the U.S. House passed the same bill. Bank treasurers worry that the new law will open the door to nonbank competitors enticing depositors with interest-like rewards for stablecoin holders, even though interest payments are specifically prohibited under the already enacted “Guiding and Establishing National Innovation for U.S. Stablecoins Act” (“GENIUS Act”).
However, consumer bankers take comfort in the fact that their retail depositors hold small balances and are unlikely to move their cash to a stablecoin, even if it pays interest. Nor do they worry that artificial intelligence (AI) could intensify competition for deposits from online offerings. They point out that they have competed against online bank deposit offerings for years and have done just fine. As for their commercial depositors, the biggest threat AI poses to deposit stability is that rapid growth in business technology spending is draining deposits faster than businesses can replenish them. Consequently, commercial and industrial loans led loan growth in the last year, either directly or indirectly through the capital markets and private equity. According to SIFMA, high-grade corporate debt issuance in the first five months of the year topped $1 trillion, while bank loans to nondepository financial institutions increased by more than 10%, to $2 trillion.
The Bank Treasury Newsletter

Dear Bank Treasury Subscribers,
It is out of print today, but somewhere, at some point in your career, you came across this book. If you did, you would remember it was a hardcover with a navy blue dust jacket. Maybe you worked on a fixed-income trading desk and saw it there, or maybe you were visiting a trading floor, sat at a desk to talk to the traders, and one of them had a copy. Or maybe you just found it one day, tucked away in a bookcase in your office library, a bit tattered, left there by your predecessor or your predecessor’s predecessor.
You may have thumbed through it without ever reading it, but, in all fairness, it was no page-turner. It was not long—the first edition was just 205 pages—and a glossary, charts, tables, and a very long table of contents took up a good chunk of the page count. You may have only heard about it without ever seeing a copy. (Your editor-in-chief concedes he was surprised to find bank treasurers who claimed they had never even heard of it.) But it was reprinted three times (most recently in 2004), and you can buy a used hardcover edition in good condition on Amazon for $7.58.
If you were entering the bond business in the 1970s, you would have read the whole book, probably more than once. In fact, your boss likely handed you a copy on your first day and told you to read it right away. You knew to be prepared the next morning because your boss (everyone knows a boss like this) was the type who would quiz you on it.
Besides, you needed to know what it said because it was a book about bond math, and you were in the bond business. But the book is not just out of print today. It seems out of date; its math examples involving 8%-10% coupon bonds are practically exotic, if not unimaginable, given today's 3- and 4-handle rates on Treasury coupons and 6-handle yields on BBB corporates and MBS. No serious rates analyst thinks an 8% 10-year Treasury coupon is foreseeable, much less a 10% 10-year Treasury coupon. Polymarket odds are in the single digits that the 10-year could even get above 5% in the next year.
Marty Leibowitz, who passed away last month, and Sydney Homer, who died in 1983, co-authored the first edition of “Inside the Yield Book” in 1972, when Kevin Warsh, now the 17th chair of the Federal Reserve, was a toddler. Arthur Burns, whose reputation as the Fed’s worst chair has endured for decades, was in his second year in office. Richard Nixon, who had put him there, was in the White House. Decades separate our bank treasury subscribers today from those days, yet bank treasurers cannot help but notice the parallels and wonder whether we are on the verge of a replay of those times.
Given surging fiscal deficits, persistent inflation, and an uncertain employment outlook for the country’s labor force and consumer base, bank treasurers are asking questions. They don’t think so, but they worry. The Producer Price Inflation print for last month did not help. Of course, bank treasurers are rate-neutral; they buy bonds for liquidity, not for the total-return concepts discussed in the book. But they are not immune to rate risk, the subject of the book’s first chapter.
And so, they have to ask: Are higher rates and more volatile markets around the corner? Is it fair to see portents and hear echoes of the old inflationary guns-and-butter fiscal spending from the Vietnam War years in today’s government deficit spending? Fiscal policy contributed to the inflation of the 1970s. Will inflation like that happen again? Will a scenario with an 8% 10-year once again seem realistic? Is “Inside the Yield Book” ready for a fourth edition?

Parallels Then and Now
Think about it! Richard Nixon told Arthur Burns, point-blank, when he nominated him, that he expected Burns to cut rates to help Nixon win his 1972 run for a second term. Similarly, Donald Trump reiterated this month that he expected Kevin Warsh to cut interest rates this year before the Midterm Congressional elections. He also told reporters (some claim out of context) that he loves inflation. One has to wonder what he really thought of Warsh’s first press conference. When asked what he thought about his vote with the rest of the FOMC to keep rates where they are, he mumbled something about it being all right and “whatever.”
Nixon tried to curb inflation by imposing wage and price controls, which made it even worse. Trump ordered retailers not to pass the cost of tariffs on to the public, but that has not prevented the public from paying more for everything. Then, as now, inflation has been running above target for several years. Elevated energy prices, driven by wars in the Middle East then and now, have stoked at least the public’s short-term inflation expectations, as evidenced by rising 1-year forward inflation readings.
Yes, the counterargument to the thesis is that the sky has not fallen, at least not yet, and that economists believe productivity gains from AI will outweigh the inflationary effects of higher energy costs. 2026 is nothing like 1972. Today’s message to bank analysts is that the war in Iran has not dampened business prospects, at least not yet. Thus, the chair and CEO of a large bank dismissed the bleak news coverage in the financial press,
“If we just read the news every day, we would have a very negative outlook for the consumer. But if we didn't read any news and all we did was look at the data we see… we would have a quite positive view.”
The president and CEO of a large regional bank based in the Southeast observed that,
“What's interesting is that most people focus on the negative. But when you look at the surveys our clients complete, 80% say their business will produce the same amount or more in the next 12 months.”
Things are so great for bank treasurers today. Oil is sailing through the Strait of Hormuz again (or will), money is flowing, and as the chair and CEO of a large bank gushed to analysts,
“It's easy being a bank today. You're going to make more money today and tomorrow than you made yesterday, and you're going to tell your board that, and your board's going to be happy. You're going to get a bigger bonus.”
It is great to work at a bank today and get paid, and it was back in 1972, too. But economists in the early 1970s were optimistic about the economy’s prospects and productive capacity, and they were not worried about inflation as a threat to continued prosperity. Look how that turned out. Then and now, optimism was the watchword among economists. The Fed was optimistic in 1972, and its economists supposedly had an inside view of the data. They are still generally constructive on the economy today, based on the latest FOMC statement this month.
Differences: Then and Now
But the financial world in 1972 was a very different place than it is today, regardless of the parallels that can be drawn. Interest rates were a lot different. You think 5.25%-5.50% for the Fed funds rate was high in 2023? When their book went on sale in January 1973, the effective Fed funds rate was 7%, and by year-end, Arthur Burns and the FOMC had raised it to over 11%.
That still was not high enough to tame the inflation gushing from the oil wells controlled by the OPEC boycott, which pushed up costs excluding food and energy, threatened the country with hyperinflation, and inspired President Gerald Ford to campaign in 1974 with the slogan “Whip Inflation Now,” or WIN.
And you think 4.5% is high for the yield on a new-issue 10-year Treasury? You have no idea how high that coupon could go or how yields whipped around in those days. There was a reason why “Inside the Yield Book” included bond math examples involving bonds paying 8% and 10%.
In those days, when Arthur Burns began his tenure as Fed chair in 1970, the 10-year yield was already close to 8%. It was 7% when the book was published, and by the time he handed the gavel to Paul Volcker in 1978, it was over 9%. And by the way, the economy survived, as the president of a regional bank in the West said this month, dismissing worries about higher rates and the threat they could pose to loan demand.
“I don't think higher 10-year rates and slightly higher short-term rates are going to impact customer demand. I mean, really, if you go back to 1970… the 10-year…was over 5%.”
Hah, the quoted yield-to-maturity (YTM) on a 10-year Treasury was much higher than that, though it was lower at first. Before Marty Leibowitz joined Salomon Brothers, the economy ran on low rates. That is what people forget. Rates were low, just like today. And then they got higher, a lot higher. In the early 1960s, for example, the effective Fed funds rate trended around 3%, the 10-year Treasury yield was under 4%, inflation was 2%, and unemployment was under 4%. By 1972, the unemployment rate (Figure 1) was already trending above 5% and peaked at 11% a decade later.
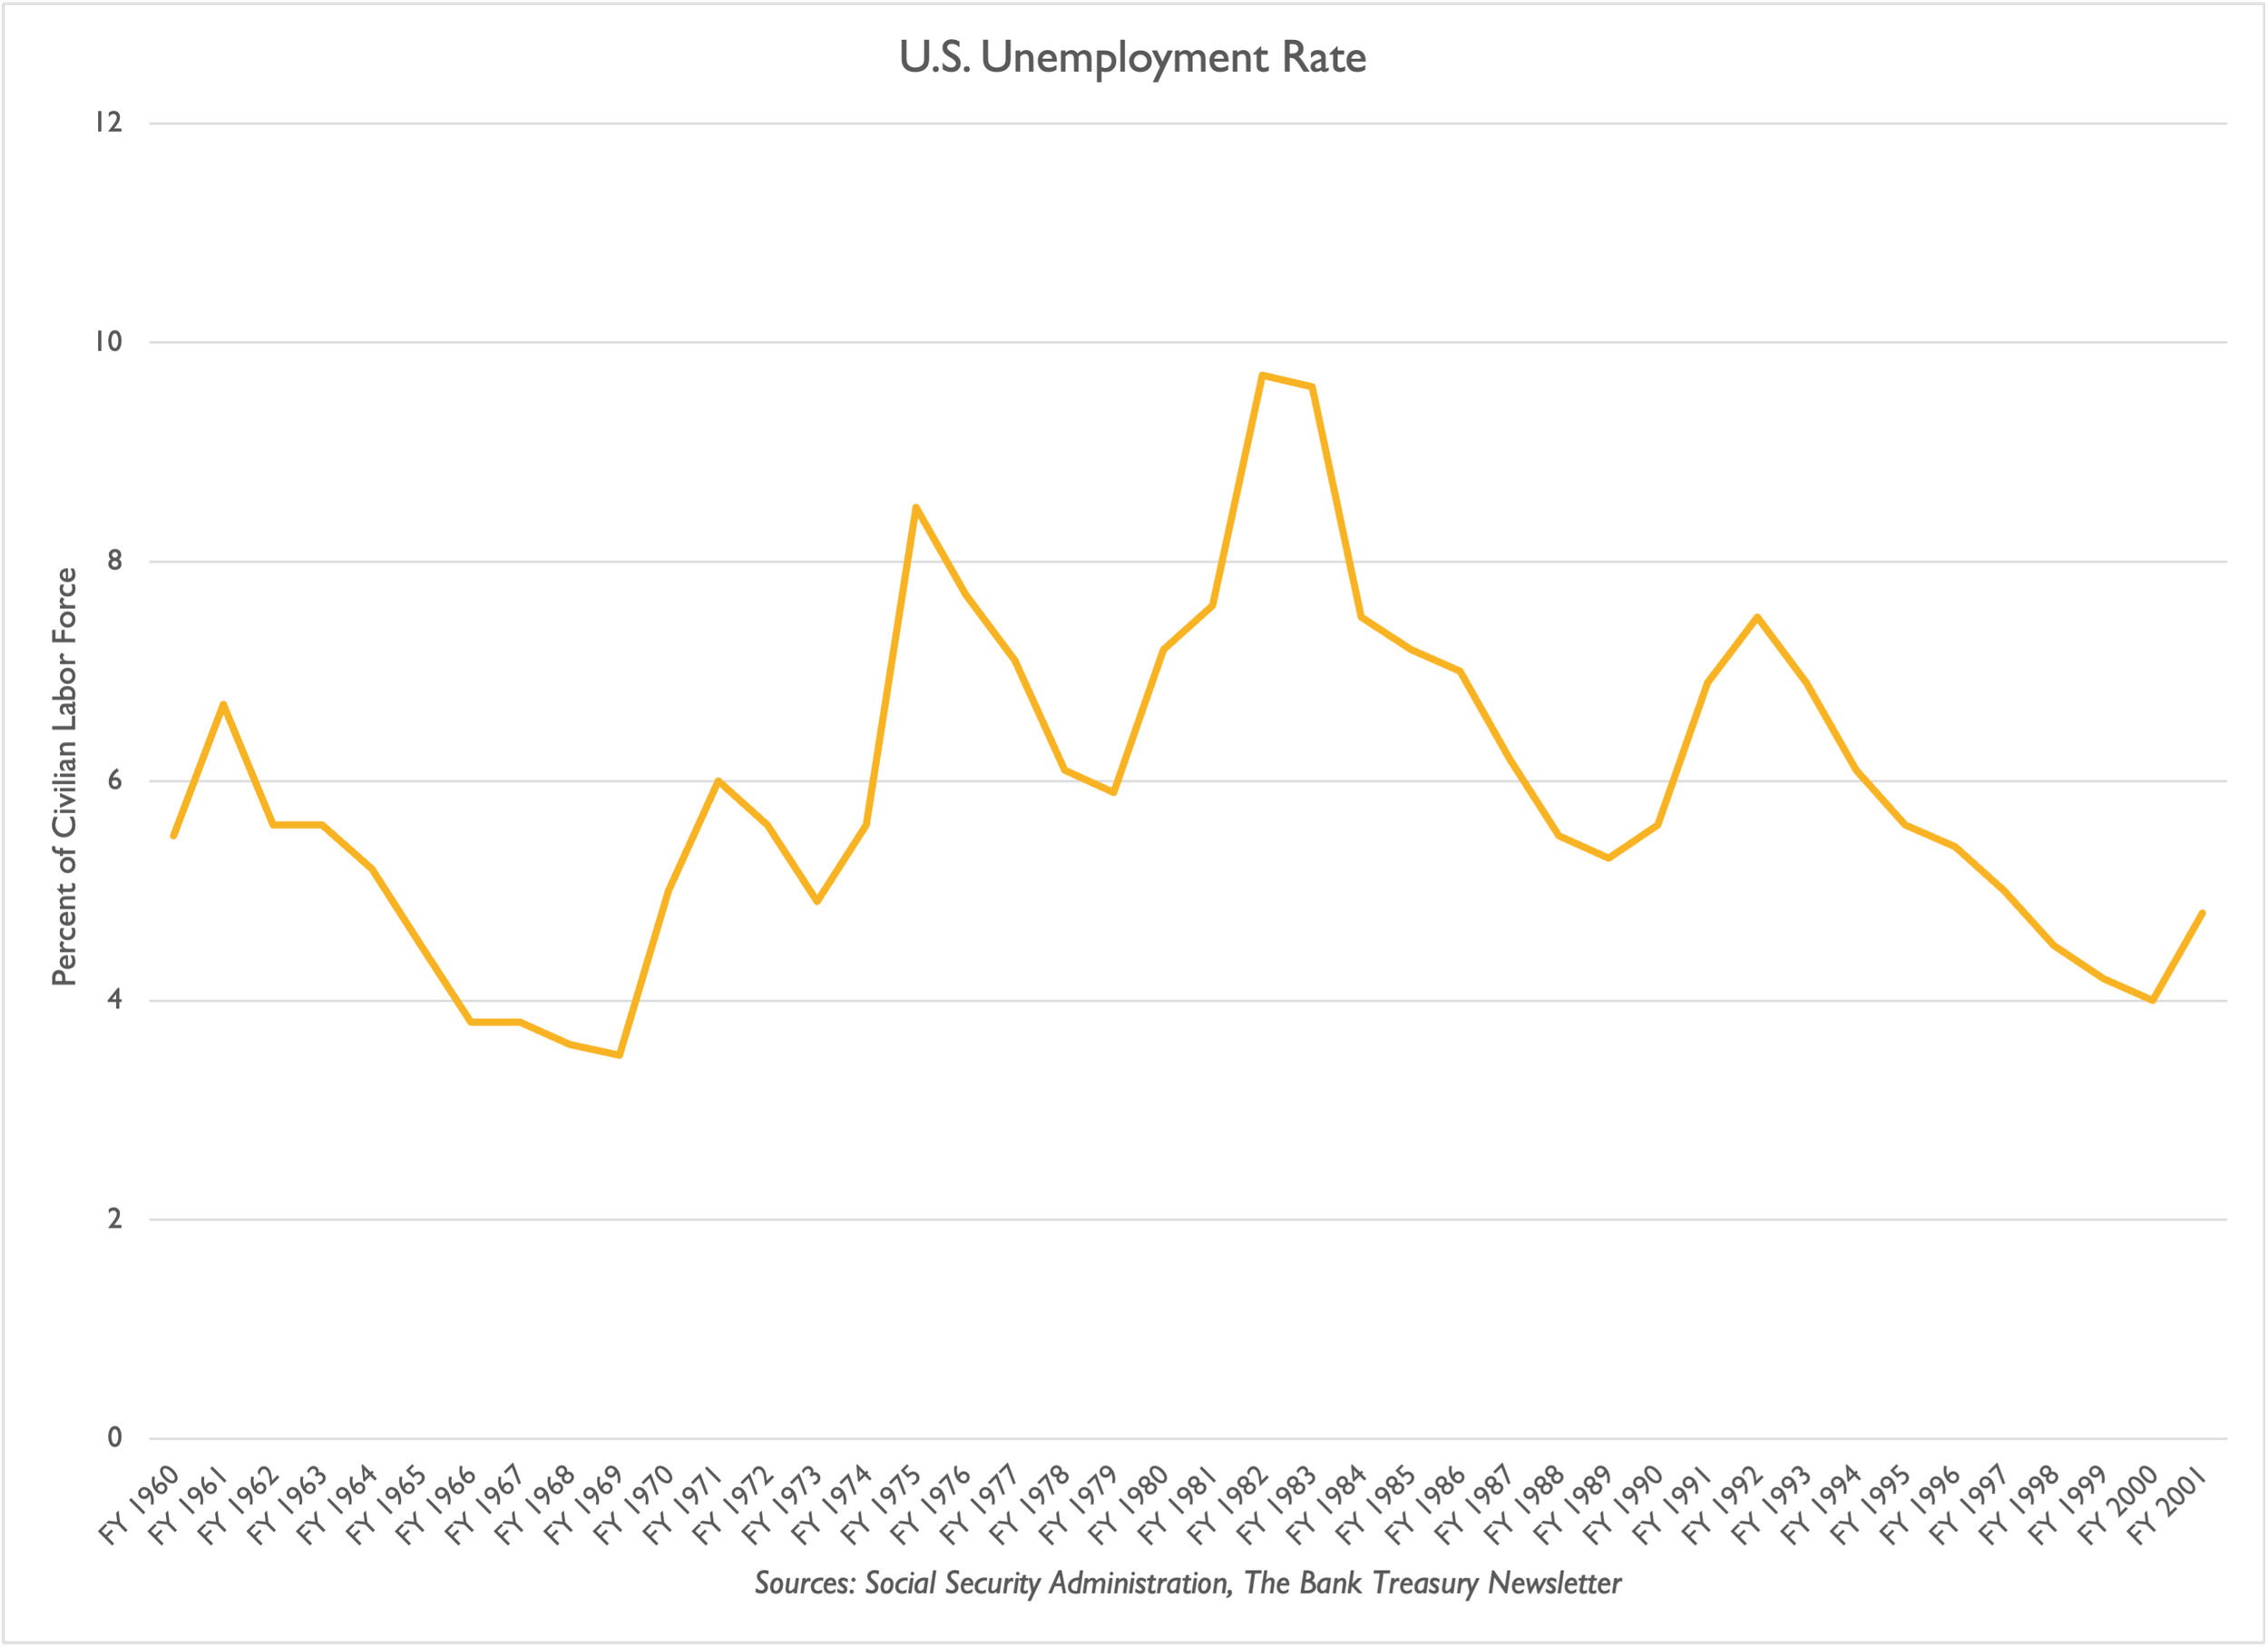
Figure 1: U.S. Unemployment Rate
By the mid-60s and through the 70s, interest rates climbed from 3% to over 20%, and the bond market roared to life, trading as intensely as on the stock exchanges. It was “welcome to the go-go years.” Suddenly, you could make a lot of money in bonds, and many newly minted MBAs flocked to the field. The reason was just math. Higher rates mean more volatility, which means more money. What a great business to work in for an enterprising mathematician.


When Marty Met Sydney
In the preface to the 2004 edition of their book, Marty Leibowitz described his first time setting foot on a bond-trading floor. It was 1970, around the time that Arthur Burns was gaveling the first meeting of the FOMC,
“From today’s vantage point, fixed income activities back in those days can seem somewhat naïve, and perhaps even rather dull. But when I first found myself on the bond trading floor at Salomon Brothers and Hutzler, it was anything but. In fact, it had some asylum characteristics, with traders and partners shouting and screaming, banging phones down in frustration, arguing bitterly with traders across the aisle, sometimes holding their heads in despair, or when a dynamite trade was consummated, giving everyone “high fives” and even occasionally jumping on the desk for a victory lap. Perhaps the most striking feature was the trays of half-eaten lunches, several days old, that could be stacked three and four high on the trading desks. The traders always ate at their desks, and rarely had time to clear away their uneaten sandwiches.”
The story of how Marty met Sydney, and went on to write “Inside the Yield Book,” went like this: In the 1960s, Marty Leibowitz was pursuing a PhD in mathematics and married Sarah Fryer in 1966. His new wife turned out to be Sydney Homer’s niece.
Sydney Homer, a Harvard graduate and former philosophy major (Class of 1922), spent his entire post-college career in the bond business because it paid much better than philosophy, and you could say that he was philosophically opposed to poverty. By the time he met Marty Leibowitz, he was already a giant in the bond market and was running Salomon Brothers’ bond market research group, which he had started when he joined the firm in 1961. A published author (his magnum opus was a history of interest rates tracing back to the Babylonians), he was known as the “bard of the bond market.”
But his bond math was lacking, and he wanted to write a book about it to articulate the concepts he believed every bond market participant needed to understand. After the wedding, he pulled his new nephew-in-law aside and asked whether he could help. He had a question.
He and everyone else he worked with at Salomon Brothers, along with all the senior bond portfolio managers they traded with at the major pension funds, were confused. They all believed, as an article of faith, that bond volatility was correlated with maturity. A long-term bond’s price should be more volatile than a short-term one. But that thesis did not always hold. Sometimes shorter bonds behaved like long ones, and long ones like short ones. He wanted to know what he was missing. Could he help?.

Bond Math Is Complicated
Marty Leibowitz worked out the algebra and explained the role of interest-on-interest in a bond's total return. In a low-interest-rate environment, compound interest is not a major factor in total return. Whether an investor spends the interest earned on the bond or reinvests it makes little difference. When rates are rising, that is another story, especially with the large coupons bond investors received in 1972.
The price of a low-coupon bond is less sensitive to rising rates because investors earn more from the bond's discount than from interest on interest. Thus, if you want to avoid any interest rate uncertainty, buying a 0% coupon bond is the ticket to a good night’s rest. The total return from accreting the discount—assuming you hold the bond to maturity—will not change over its life. It is fixed at the time of purchase.
Dealing with coupon interest is another story. An investment in a high-coupon bond with a small discount to par will generate more from compounding, and its price will be more sensitive to rate changes than an investment in a bond with a low coupon and a large discount.
But that was only part of the explanation for the variations Sydney Homer’s colleagues observed in the bonds they traded. Many factors influence the math behind bond prices and total return, including the frequency of coupon payments and the term to maturity. Perpetual bonds, as discussed in their book, are an extreme example in which current income and disciplined reinvestment matter to total return.
The authors dug into the bond math by comparing two 20-year bonds: one that paid 8% and traded at par, and another that paid 4% and traded at a deep discount. If you bought a 20-year Treasury paying 8% at par and reinvested the semiannual coupon payments at 8% until maturity, for every $1,000 invested, you would earn $1,600 in interest payments and $2,201 in interest on interest. Interest on interest would account for 58% of the total return.
But if you bought a 4% coupon bond at a discount to yield 8% and reinvested the coupon interest at 8% for 20 years, your interest-on-interest contribution to total return would decline. You would generate $2,296 in interest income. This sum would include $396 from the bond’s accretion of discount to par, $800 from coupon interest, and $1,100 from coupon reinvestment—interest on interest—the last of which would make up 48% of your bond’s total return.
The lower the coupon interest, the lower the reinvestment rate, and the shorter the maturity, the less interest-on-interest matters to total return. That pretty much explains why bank treasurers do not spend much time thinking about the topic. When a bank treasurer buys a bond, liquidity is the first, second, and third question asked before they say “done” on the trade.
Yield is important, of course. Bank treasurers have to earn a spread over their cost of funds to keep their jobs, but they are not paid to swing for the fences, nor do they intentionally buy long-term bonds. They buy short-term fixed-income bonds, trading off higher yields for greater liquidity.
True, the 2- and 3-handle MBS they bought right after COVID ended up with durations that extended well beyond their investment horizon. When the first edition of “Inside the Yield Book” came out, there was no special chapter explaining how prepayment options introduce a whole new level of complexity and volatility risk for bond investors, because the MBS market was just getting off the ground in the early 1970s. Duration calculations in the book were based on the assumption that bonds pay off at a definite point in time. Extension risk was unknown.
For bank treasurers in general, buying bonds is not the path to NIM accretion. They want to leave room on the balance sheet for loans. As the president and CEO of a large regional bank based in the Southeast told analysts, adding bonds can drag down the margin.
“The reason that you're seeing any sort of margin compression…is…that…increasing our securities and cash as a percentage of total assets. And that's what's condensing the margin a little bit.”
“Inside the Yield Book” offered some consolation to bank treasurers who bought bonds in 2020 and 2021 and are waiting for them to roll off. As explained in Chapter One,
“Long-term bonds bought a few years ago at yields of 4 percent to 5 percent are actually permitting the purchasers to receive a much higher compound yield than the expected rate if the purchasers have been reinvesting their coupons. This is because those lower yields at cost assumed future reinvestment rates of 4 percent to 5 percent, while their coupons have recently been reinvested at rates as high as 8 percent to 9 percent.”
Bond buying left a bitter taste they will not soon forget, and the higher reinvestment rates on their coupon interest have not been enough to ease their pain. But they can take solace in the knowledge that the mistakes they made in 2020 and 2021, when they bought the lowest-yielding bonds they had ever bought in their careers, which are still trading at a discount, will finally roll off and be behind them in the next couple of years. As the president and chief operating officer of a large Western-based regional bank told analysts, AOCI’s negative days are numbered.
“AOCI accretion will go back into earnings…during that two-year period. At that point, we're no longer the bank that had a big AOCI hole to fill. That will have completely healed.”
Unless they borrowed to finance their investments and are now underwater, paying higher interest than they earn, bank treasurers today are inclined to hold their underwater bonds until maturity. As the CFO of a regional bank based in the Southeast put it, the AOCI accretion his bank was earning is a tailwind that benefits his bank’s margin and net interest income.
“The improvement in our margin and NII…benefits from fixed-rate asset repricing…as well as our securities portfolio continues to roll up the curve.”
Now, if a bank treasurer were looking to enter the market today to buy MBS and had a choice between a new-issue current-coupon bond and a low-coupon seasoned bond, the book’s insights on price volatility and the relative sensitivity of par and discount bonds to interest-rate changes could be useful. But bank treasurers were not the book’s primary audience then, and, in any case, there is not much supply in secondary markets of seasoned, deep-discount, low-coupon MBS that other bank treasurers are trying to sell, worth a bank treasurer’s time who wants to go long.
The seasoned bonds available on the market today are reminiscent of the old flower bonds, all of which matured by the end of the last century. Flower bonds, low-coupon, low-yield Treasurys sold by the Treasury at an original-issue discount, were no bargain, which tells you something about what a bank treasurer could expect to pay for a seasoned low-coupon MBS today. The only reason to buy them was that investors could use them to settle their estate taxes. Like seasoned low-coupon MBS today, flower bonds were scarce, especially after President Nixon ended the program in 1971.

Why Wall Street Needed Marty Leibowitz
After he finished his presentation, Marty Leibowitz had a question. Why hadn’t Sydney Homer consulted his firm’s in-house mathematician? Surely he could have explained the math. But the firm had no one like that, and the role did not exist anywhere else on Wall Street, for that matter. There had never been any need for one because bond prices were usually stable and predictable.
But portfolio managers at pension funds and insurance companies needed to understand the math behind the bonds they held. As Marty discovered, they did not appreciate that basic bond metrics, including YTM and duration, depended heavily on the bond’s reinvestment rate remaining unchanged over the bond’s term. As the authors wrote in Chapter One, titled “Interest on Interest,”
“…some investors mistakenly expect that a bond purchased at a given yield will always produce that rate as a realized compound yield over the whole life of the bond. If future reinvestment rates during the life of the bond are less than the purchase yield, then the realized compound yield for the whole life of the bond will be less than the purchase yield; if future rates are higher than the purchase yield, then the realized compound yield will be more than the purchase yield.”
Reinvestment rates matter, even if bank treasurers have shorter investment horizons than portfolio managers running pension and insurance portfolios. Interest rate risk is inherent in asset-liability management because it relies on basic assumptions about the timing of cash flows. Even if bank treasurers manage their net interest income to be neutral to changes in interest rates, the direction of interest rates and the timing of changes still matter. Buying short-dated bonds just before rates fall hurts just as much as buying long-dated fixed-rate bonds before rates rise. As the authors continued,
“It is obvious, however, that shorter maturities, while reducing or almost eliminating the uncertainty of the rate of interest-on-interest, do not solve the problems of maintaining future income. Indeed, the uncertainty is greater with shorter-term bonds because, when reinvesting…at maturity, the coupon, in addition to the compounding factor, is uncertain. Thus, the old rule will usually hold: if future rates are to rise, shorts bought now will be better than longs; if rates decline, longs will be better than shorts.”
But combine a short-term investment horizon and rising rates, and you have a formula for improved NIMs and profits. As the CFO of a regional bank based in the Southeast explained, a rising rate scenario and a steepening yield curve would be a dream come true for shareholders,
“We're neutral to short-term rates, but longer-term rates, as they tick up, we'll benefit from that…For us, with higher rates, we benefit from fixed asset repricing turnover.”
The firm needed someone like Marty Leibowitz to make sense of the numbers. One thing led to another, and another, and another. It took a few years because nepotism played no role when he began his career in 1969 as Salomon’s in-house mathematician and secured a seat on the firm’s bond-trading floor.

From Paper and Pencil to Computers and Calculators
The world of bond trading in the late 1960s was still lit only by fire, so to speak. Traders had no access to cell phones or the internet. There were no trader screens to see a live market, no exchanges for bond trading, no computers, and Michael Bloomberg was still working as a bond salesman at Salomon Brothers. Calculators were new and rudimentary at best—you could still do better with an abacus or a slide rule. Bond traders kept a lot of pencils and paper.
If a trader needed to know where to bid or offer a bond, the first thing they would do was reach for the morning edition of the Bond Buyer to find municipal bonds with similar characteristics that had traded the day before. Back then, bonds did not move much anyway, so where a bond traded yesterday was probably a good indication of where it would trade today.
The other tool he consulted was the Yield Book, a printed volume of bond tables. A bond’s yield to maturity was listed vertically, and its maturity was listed horizontally. Other tables provided duration, current yield, and related bond statistics. The numbers in the middle were the discount factors the trader used to price the bond.
If the parameters shown in the tables differed from those of the specific bond up for a bid or offer, that is where paper and pencil came into play. The trader would work out a price interpolation and build in a spread on the trade wide enough to drive a proverbial truck through (and a bigger bonus check). Unlike today’s markets, where pricing transparency is the norm, in 1969, it was not hard for traders to monetize the price information they could glean only by talking to other traders all day over the phone. There is a vestige of this swagger in today’s leveraged loan market.
Suffice it to say, however remunerative it was for bond traders, pricing bonds in the 1960s was cumbersome and ill-suited to the faster-paced world it was becoming. For one thing, rates were rising beyond the ranges listed in the tables in the Yield Book. If Wall Street wanted to make more money by driving more trading volume, it needed a better method.
Enter Marty Leibowitz, who designed a computer program to speed up bond pricing without relying on the Yield Book tables. At first, he was a nice-to-have on the trading floor, not a must-have. The traders could get by without him.
“The traders and salesmen were generally kind to me. They became even kinder when I developed a package of computer programs that facilitated more trades. Also, with my little time-sharing terminal, I could determine the yield for any given price with great speed and accuracy. However, the traders were themselves very adept at using the look-up tables—their so-called “yield books”—to find the yield values required to complete their trades. So, at first, my “high-tech” yield calculator was just a curiosity.”
But that changed by 1970. As he continued,
“But in 1970, when interest rates moved higher than the levels available in any of the traders’ yield book tables, I became the only game in town. Senior partners lined up in front of my terminal, desperate for the number that could confirm their latest trade. Needless to say, this boosted my standing on the floor, although it put me in a harrowing position in which any mistake could prove fatal.”
One thing about Wall Street is that if something works, everyone wants it. Marty went from being the only game in town to the mother of invention.
“It is said that need is the mother of invention. In the financial world, the gestation period can be very compressed. It was not many weeks before computer terminals and clunky special-purpose hand-held yield calculators sprouted up all over the trading floor. My reign as the sole “yield keeper” came to an abrupt end.”
The transition to computers was both good and bad. It sped up trading, that was for sure, and led to much better bonus checks on Wall Street. But the Yield Book tables had something computers could not offer,
“The broad-based use of computers to replace the yield book tables did nothing to further the general understanding of what a bond yield was all about. In fact, the great facility of the computer may have been a step backward. Traders could punch in a few numbers, and the desired yield value would pop up. There was no need to ponder what it all meant, or what would happen if you changed the coupon or the maturity. At least the old yield book procedure required a table lookup and interpolation, which forced the trader to move a finger up and down the yield rows and across the maturity columns. So, in a sense, the advent of computer capabilities reduced the need to appreciate what yield really meant. This may be a general problem of our computer age. The computer can be an effective facilitator in all sorts of areas, but its use on a rote basis also dulls the desire to seek a deeper understanding.”
AI: Promises and Risks
Computers are far more powerful today than they were in Marty Leibowitz’s day, but his observations remain just as relevant. Bank treasurers, along with regulators, legislators, and other participants in the financial markets, are excited and worried about the potential of artificial intelligence (AI). There is a lot of good it can do and a lot of business potential, as the CFO of a large regional bank based in the Midwest said.
“I mean, there is no doubt that agentic commerce and agentic financial services are going to be part of the future. We think there is real value in creating agents to do the jobs for our customers. We think that the AI is going to impact the financial system and the economy in ways that no one is expecting today, and that you've got to be always forward-thinking to make sure you take advantage of those opportunities.”
AI has the potential to increase productivity, which the chair, CEO, and president of a large bank based in the Midwest described,
“If AI tools do what we are beginning to see them do, we could have the same client adviser in a branch handle twice the customer base. Our AI at the branch can read notes on every customer's interaction across all channels and give the adviser a precise view of the best product for the customer…And that increases your leverage.”
On the other hand, AI could be a source of significant chaos. Theoretically, it could trigger a bank run, as Congressman Bill Foster warned this month at a House Financial Services Committee hearing,
“I don’t think that we are prepared for an agentic AI bank run…We are not ready…AI could trigger bank runs in seconds…If everyone had their personal AI agent with standing orders that, if you even hear a rumor that my bank is in trouble, just get my money the heck out of there.”
Leaving aside existential threats such as a bank run, bank treasurers are asked all the time about the threat AI poses to their bank’s deposit stability. Their boards ask them the what-ifs, such as what if AI enables their sleepy deposits to automatically look for the best rate in town and move? But for the most part, bank treasurers are not worried. For one thing, as the above-quoted CFO continued, the technology is just not there yet. Even if it were, the economics do not add up.
“We also think that this conversation around deposit sorting is potentially a little bit in front of the actual realities of the economics of the situation. I mean, the median deposit account in the consumer business is less than $5,000…A customer picking up 100 to 200 basis points equates to $50 to $100 a year. That they're actually going to do a lot of work to create complexity in their financial lives--we don't think that that is quite the narrative that's out in the market right now.”
The economics do not add up, even if the balance were twice as high. The CFO of another Midwest-based regional bank insisted that the average checking account at his bank,
“…is around $10,000 in size. There's just -- it's not very relevant to conceive of overly optimized outcomes there.”
Deposits are not moving for a better offer, at least not retail deposits. The president of a large regional bank in the Northeast pointed to the many online banks already operating in the U.S. that are offering higher rates to attract deposits, noting that,
“Our average customer has $3,500 in checking, right? That's your day-to-day operating cash to manage your payment, make your mortgage payment, pay your bills, and pay your grocery bills. I don't think that's going to get optimized by yield seekers. And then when you think about interest-bearing deposits, look, direct banks have been around for 30 years, and they've consistently paid at or higher than traditional regional banks, and the percentage of the US deposits that have gone to direct banks has been relatively muted. It's 12% or 13%, and it's kind of flatlining-ish there.”
Excess savings that someone would take the trouble to hunt down extra basis points on a CD is a myth, as the president and CEO at a large regional bank based in the Southeast explained,
“When you think about our customers, they maintain in their accounts about 1.6 times what they spend every month. So they have very little investable excess balances. Most have, if they have savings, it's for an emergency, and that's it. And so I don't think that, I do believe there may come a time when agents do help people search for the best rate and move money around, and people have confidence in that capability, and they're willing to let a bot move their money around. I don't think that's going to impact our customer base anytime soon. One, I don't know that our customer base would be willing to accept that sort of innovation; two, more importantly, they just don't have the excess liquidity to rely on that service.”
But not all retail deposits are the same. Published research from the BIS this month found that deposits originated by direct, online banks were more likely to move to another bank for a better rate than those originated in a traditional branch. They were also more likely to run on rumors.
AI is already affecting the stability of commercial bank deposits. However, changes in commercial deposit balances at one bank or another have not been driven by competition from mutual funds or crosstown rivals, or even by negative rumors about a bank’s condition. According to research from the St. Louis Fed, business deposits are down due to the AI boom, with money flowing into AI spending.
Spending on software and equipment is surging to keep pace with rapid AI development (Figure 2), while cash balances have flattened since COVID, when companies stockpiled cash on their balance sheets at record levels. By 2030, researchers project that businesses will spend nearly $7 trillion on AI, outpacing their cash balances and forcing them to rely increasingly on capital markets for financing.
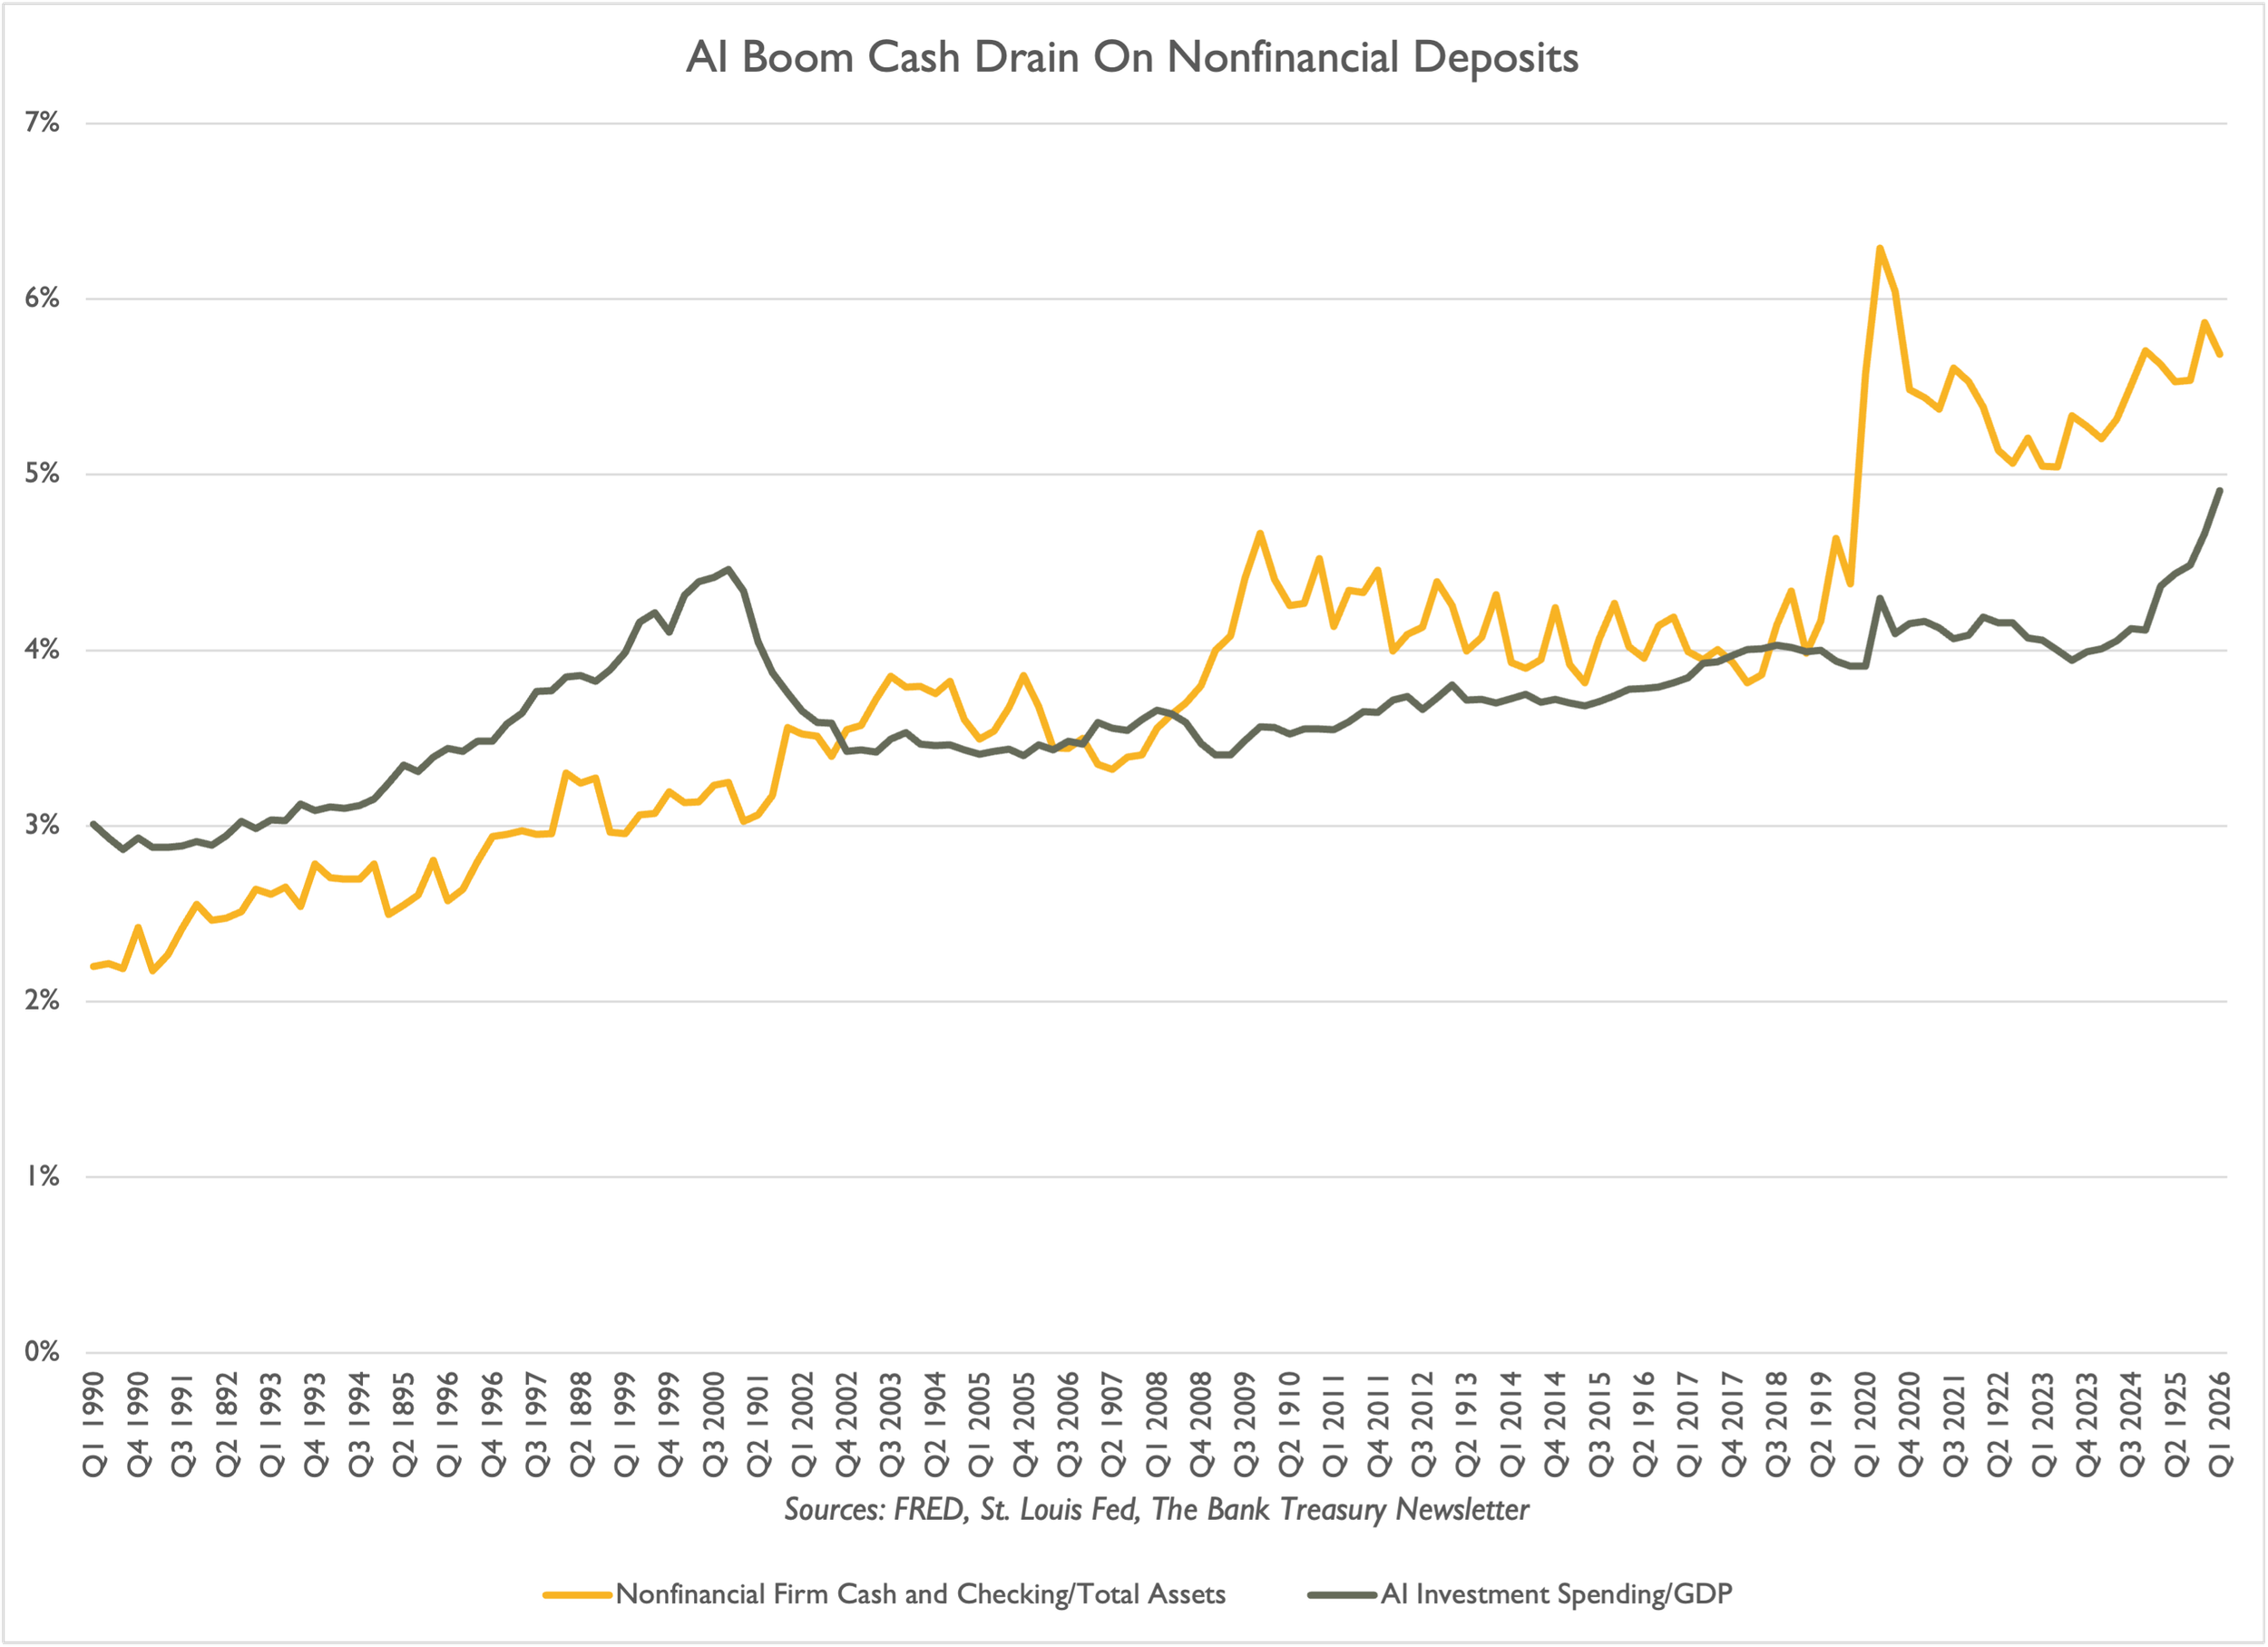
Figure 2: AI Boom Cash Drain On Nonfinancial Deposits
In fact, as the co-president of a global bank (and former bond trader) admitted, the banking industry cannot even meet all the demand for financing to cover spending on AI,
“There is a significant need for capital for all this investment that's taking place…I think that…you're going to continue to see it. The candid response…the demand, the size, and the scale of the financing that's being done is well beyond anything that can be handled in the loan market for banks, and that's why you're seeing the expansion into the bond markets, which is why the bond markets were created in the first place…Most of the activity…you're seeing is investment grade.”
For all the cash invested, the productivity gains Kevin Warsh expects the economy to reap, which could support an argument to keep rates low or cut them, remain unrealized. AI technology will only realize those dreams if it meets a critical need right away. The old saying, “build it and they will come,” only makes sense when “they” need to come. When Marty Leibowitz joined Salomon Brothers as its chief mathematician, it was because rapid changes in interest rates had rendered the printed yield book tables the traders had been using cumbersome, and he solved a problem that urgently needed solving. Calculators on the trading floor became ubiquitous for the same reason, helping increase the firm's trading volume.
But it all began with a problem that needed solving. Right now, AI is still a shiny toy for bank treasurers, left to the IT department to implement for rote functions. Some of our readers created bots to brief them on news, help set up calendars, or summarize recent cash flows. But they are just beginning to realize the technology’s true potential. Productivity gains will come when bank treasurers learn to use it as an indispensable tool to navigate an interest-rate environment that could be as volatile as it was 50 to 60 years ago, and where we may once again see rates high enough to make interest on interest great again. AI’s true potential lies not in replacing human judgment but in enhancing it.
Alpha Hunters, Beta Grazers, and Bank Treasurers
As Marty Leibowitz wrote in 2005, there are two types of investors, alpha hunters and beta grazers. Alpha hunters look for market inefficiencies and seek to exploit them for gain. They take risks, accept that they will win some and lose some, and, over time, gain confidence in their instincts to beat the index they manage against. Beta grazers are essentially along for the ride, passive investors who have hitched their performance to where the market goes. Generally speaking, bank treasurers are predisposed to adopt a beta-grazing approach to their bank’s investment portfolio. But in practice, they adopt a middle ground because being neutral on interest rates does not mean they do not take interest risk or make interest-rate assumptions. It goes with the territory.
The CFO of a large regional bank based in the Midwest reminded analysts at an industry conference this month that traditionally, banks do not take positions on interest rates,
“Our long-term bias is to be neutral. We just don't think that investors are paying us to take big market positions.”
There is a good reason investors do not pay bank treasurers to take positions in the rates market, long or short: they are not good at it, as their board of directors must remind them every time the bank’s underwater bond portfolio comes up for discussion. And besides, predicting the future path of interest rates is a fool’s errand. This is especially true these days, when economists themselves have so much trouble figuring out the economy's future, which interest rates are presumably meant to reflect. The market may be efficient at pricing risk, but it depends on information that is far from complete, and the economic consequences of the war with Iran are still filtering into the statistics that FOMC members use to decide monetary policy. Gas prices are lower than they were a month ago, but the effects on consumer behavior may not be.
They may be rate-neutral, they may be beta-grazers, and they may still be smarting from the bond portfolio, but bank treasurers still care where short- and long-term rates are headed. As Marty Leibowitz explained, future reinvestment rates matter. They matter to total returns for pension funds and insurance company portfolios, and to bank treasurers' projections of NIM and net interest revenue. So, if you are not good at rate projections, what do you do when you need to have a view on rates? Where do you turn?
Certainly not to the Fed’s dot plot projections. Even setting aside the fact that Kevin Warsh wants to scrap them, the dot plot has been an unreliable guide to the future path of rates. A year ago, FOMC members expected to cut rates, and now they seem set to raise them. As bank treasurers also know, forward rates have been just as unreliable as the dot plot for gauging where rates are headed. The joke is that forwards are never right, and pricing is distorted by technicalities, particularly at the front end of the yield curve, where market overreactions to day-to-day macroeconomic factors are often evident.
Last June, the Fed’s Interest on reserve balances was 4.40%, a 1-year Treasury YTM averaged 4.06%, and a 2-year averaged 3.89%. The inverted yield curve signaled a couple of rate cuts. The FOMC, in fact, delivered three 25-basis-point rate cuts before the end of 2025, bringing the target Fed funds rate down from 4.25%-4.50% to 3.50%-3.75%.
Heading into this month, forward rates implied that short-term rates would remain relatively stable for the rest of the year, with perhaps one 25-basis-point hike in the cards, based on 3.80% for 1-year and 4.00% for 2-year. As this month ends, with the 1-year at 4.00% and the 2-year at 4.15%-4.20%, the picture looks different, reflecting market expectations of at least two, and possibly three, rate hikes in the coming months.
If you buy a 1-year now at 4.00% and rates are unchanged a year from now, you will kick yourself for not buying the 2-year and earning an extra 15-20 basis points over the next two years. On the other hand, if you buy the 2-year and lock in another 15-20 basis points for two years, and then Kevin Warsh reverses all of the last three cuts over the next year, returning the Fed funds target to 4.25%-4.50%, the higher reinvestment rate you earn on the extra 20 basis points may not cover what you could have earned by sticking with a 1-year and rolling for the second year.
In a 1995 essay, Marty Leibowitz described what he called the “persistence effect,” a key assumption bondholders make when they buy a bond,
“This analysis…explored the implications of accepting or rejecting the view that forward rates necessarily give the best predictions of future yield curve shapes…The persistence factor reflects the expectation that rates will remain at their current levels: A persistence assumption of 1 means spot rates are expected to persist; a persistence assumption of zero means they are expected to give way to forward rates…For example, under a persistence assumption of 1, an investor generally expects to be rewarded for extending duration when the yield curve is positive. A persistent assumption of zero--meaning that forward rates will be realized--eliminates any incentive to pursue higher-yielding securities. Thus, all investment decisions rely on an assumption, perhaps implicit, about persistence.”
If a bank treasurer’s persistence assumption is 1, meaning the 1-year in June 2027 will remain unchanged at 4.00%, they buy the 2-year. If they think the 1-year will be at least 4.2% next year, they should stick to the 1-year. Managing interest rate risk requires discipline: sticking to what you believe. That is why bank treasurers have stayed short this year: they believe, based on what they see, that the forwards are underestimating how high rates can go. As the above-quoted CFO from the large regional bank based in the Midwest continued, after telling analysts that he was not getting “paid” to take market positions on rates, his investment choices are based on a disciplined approach to the bond portfolio. Timing always matters when you buy bonds, and timing is all about discipline.
“But we also want to be very disciplined on how we get there. One of our big lessons as we think about investing is that entry points matter…We believed that trends pointed to higher-for-longer. Everything that's happened in the last six to eight weeks has reinforced that view.”
Instead of relying on forward-looking guidance and dot plots, bank treasurers need to decide for themselves where rates are headed. As the CFO continued, his higher-for-longer view on rates is based on his expectation that inflation, trimmed or not, will not return to the Fed’s 2% target without rate hikes.
“The impact of the tax bill, the impact of the infrastructure spending associated with the data center buildouts, and what we're seeing in the labor market, all indicated that inflation was likely to be stickier than expected.”
Interest on Interest: A Hard Truth
Let’s say you are a lucky alpha hunter, and every investment decision you make and every risk you take works out perfectly. You not only anticipate higher-for-longer but also guess exactly how high and how long rates can go before they peak. What could go wrong? In his preface to the 2004 edition of “Inside the Yield Book,” Marty Leibowitz reminisced about the time Sydney Homer asked him the following hypothetical math question:
Let’s say you are a Roman citizen living 2,026 years ago, and you take a drachma, a unit of currency that in those days would be worth $100 in today’s money, and invest it in a perpetual 4% bond. You take the semiannual interest payments and reinvest them religiously in new perpetual bonds paying 4%. You arrange for your 4% perpetual bond portfolio to pass down through the generations to this very day. Let’s say, somehow, the Roman government is still paying your descendants, or some other government assumed the original debt. Let’s say all this. The question is, how much money would your latest lucky ducky descendant have?
Hint: It would be more than Elon Musk has today, post-SpaceX's initial public offering. According to Google AI, the answer is $3 undecillions, a 1 followed by 36 zeros. Marty Leibowitz might have taken longer to figure this out back then, with or without a math PhD. Regardless, it was Sydney Homer’s second question that stumped him, as he reminisced in his 2005 essay, “Alpha Hunters and Beta Grazers.”
“His second question I found not so easy to answer: What happened to all that potential wealth? Sidney had a way with the Big Ideas and answered this succinctly, if not wholly satisfactorily, on page 32 of Inside the Yield Book: “Aside from the destructive effects of wars, revolutions and inflations, and the incidence of taxes, there is a very human propensity to consume.” This question is still well worth the pondering, notwithstanding its rather depressing implications.”
Stuff happens. You slip up, miss a deadline, hold on to cash longer than you intended, and even when you make every right decision, things don't always go as planned. Nothing goes up exponentially forever, not fortunes or markets. Eventually, despite every conceivable hole being filled, you stumble. Or you decide one day to blow everything you have on crypto or a nice vacation. Who knows? The lessons for bank treasurers are that they can never escape risk and that the goal is always to remain invested. As Marty Leibowitz wrote in the preface to the third edition of “Inside the Yield Book,”
“… are like the great sailors: They have the courage to set forth, they know where they want to go, they have a strong gyroscope to keep them on course, they have appropriate respect for the dangers of the sea and its potential for radical shifts in weather and currents, and they are not afraid to be alone for long stretches.”
Behind every great sailor is a great navigator who can use available technology to chart a course through long stretches and reach the other side. Marty Leibowitz was that kind of navigator, the kind who could explain the math behind the numbers and to whom traders and portfolio managers turned for help when they could not solve their math problems with their bond tables and paper and pencil.
In a short time, however, technology arrived, and everyone turned to their vintage Litton Monroe calculators to handle those questions. Today, with AI, you do not even need a calculator. But no machine could replace Marty Leibowitz, then or now. He will be missed.
The Bank Treasury Newsletter is an independent publication that welcomes comments, suggestions, and constructive criticisms from our readers in lieu of payment. Please refer this letter to members of your staff or your peers who would benefit from receiving it, and if you haven’t yet, subscribe here.
Copyright 2026, The Bank Treasury Newsletter, All Rights Reserved.
Ethan M. Heisler, CFA
Editor-in-Chief
This Month’s Chart Deck
Bank treasurers are optimistic that the negative fair value in their bond portfolios will soon be resolved. Last quarter, the negative gap between the fair value of their combined held-to-maturity and available-for-sale portfolios and their respective amortized cost fell to 5%, down from 11% three years ago. This improvement is partly due to portfolio roll-off and partly to mortgage rates falling and stabilizing at levels still high relative to pre-Global Financial Crisis rates, but lower than they were three years ago, when Silicon Valley Bank failed (Slide 1).
The shape of the yield curve has undergone a significant transformation since the start of the new year. The front end of the Treasury curve, from 3 months to 5 years, bear-flattened and then steepened from inverted to positively sloped (Slide 2). Meanwhile, the belly of the curve flattened (Slide 3).
Since 2022, a higher-rate environment has pushed term premia across all Treasury zero-coupon bonds into positive territory. Currently, a 10-year zero-coupon bond offers an 80-basis-point premium for extending the term rather than rolling over cash daily for 10 years. This is a shift from minus 60 basis points in 2020. Before the financial crisis, investors earned over 100 basis points for maintaining such long-term positions (Slide 4).
Kevin Warsh formed a task force to explore reducing the Fed’s balance sheet. However, to provide clear direction, he should first understand why the Treasury is now holding nearly $1 trillion in the Treasury General Account (TGA), compared with just a few billion dollars before the Global Financial Crisis (Slide 5). Additionally, even if reducing the Fed’s balance sheet is a goal, he and the Treasury Secretary must determine how to manage the growing flow of Treasury debt entering the market, which continues to displace other capital-market debt (Slide 6).
But high-grade corporate bond issuance rocketed higher this year, reaching $1 trillion in just the first five months (Slide 7), while a steeper yield curve incentivized them to extend the duration of their bond portfolios (Slide 8).
In bank treasury land, the news remains positive. Both loans and deposits are growing ($13 trillion and $19 trillion, respectively), allowing bank treasurers to run off some of their brokered deposit funding over the last six months, although they notably increased their advances from the FHLBs over the same period (Slide 9). Even as deposits grew, money market funds also grew, adding another $100 billion in assets under management since the new year, bringing total assets under management to $8.4 trillion (Slide 10).
Bond Portfolios Are Still Climbing Back to Par
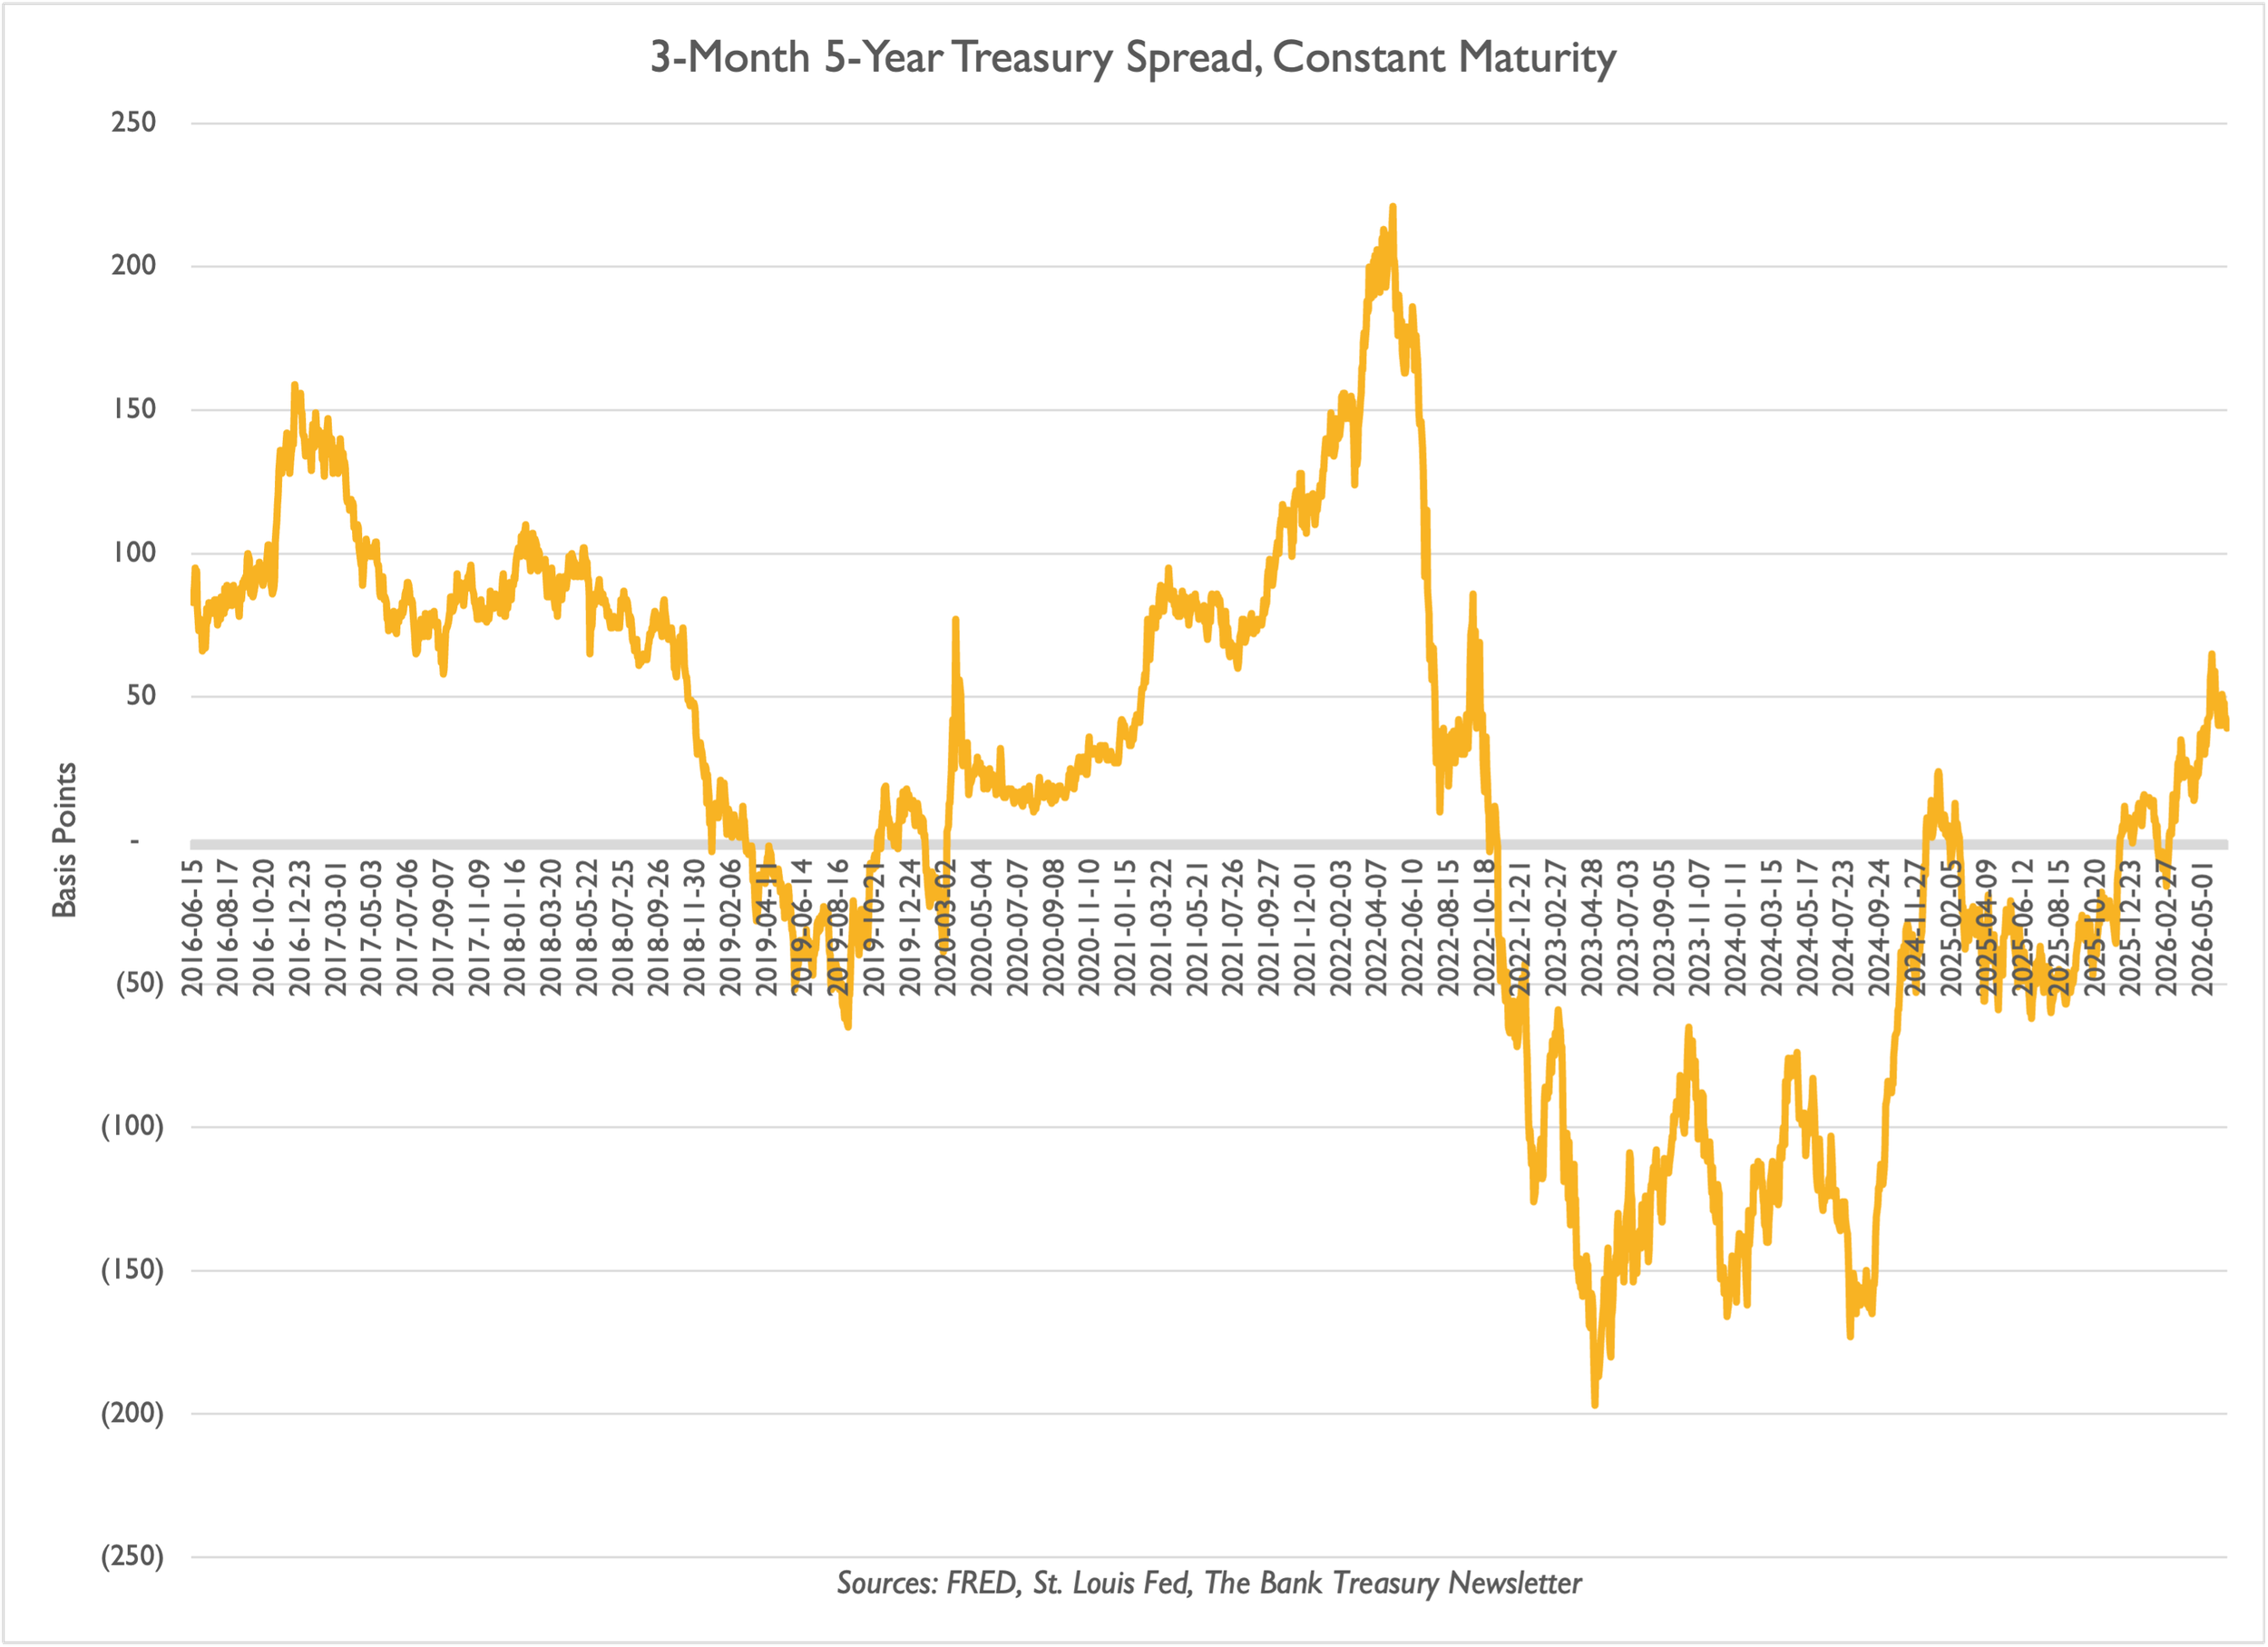
Front-End Steepens as Rate Hike Odds Grow…
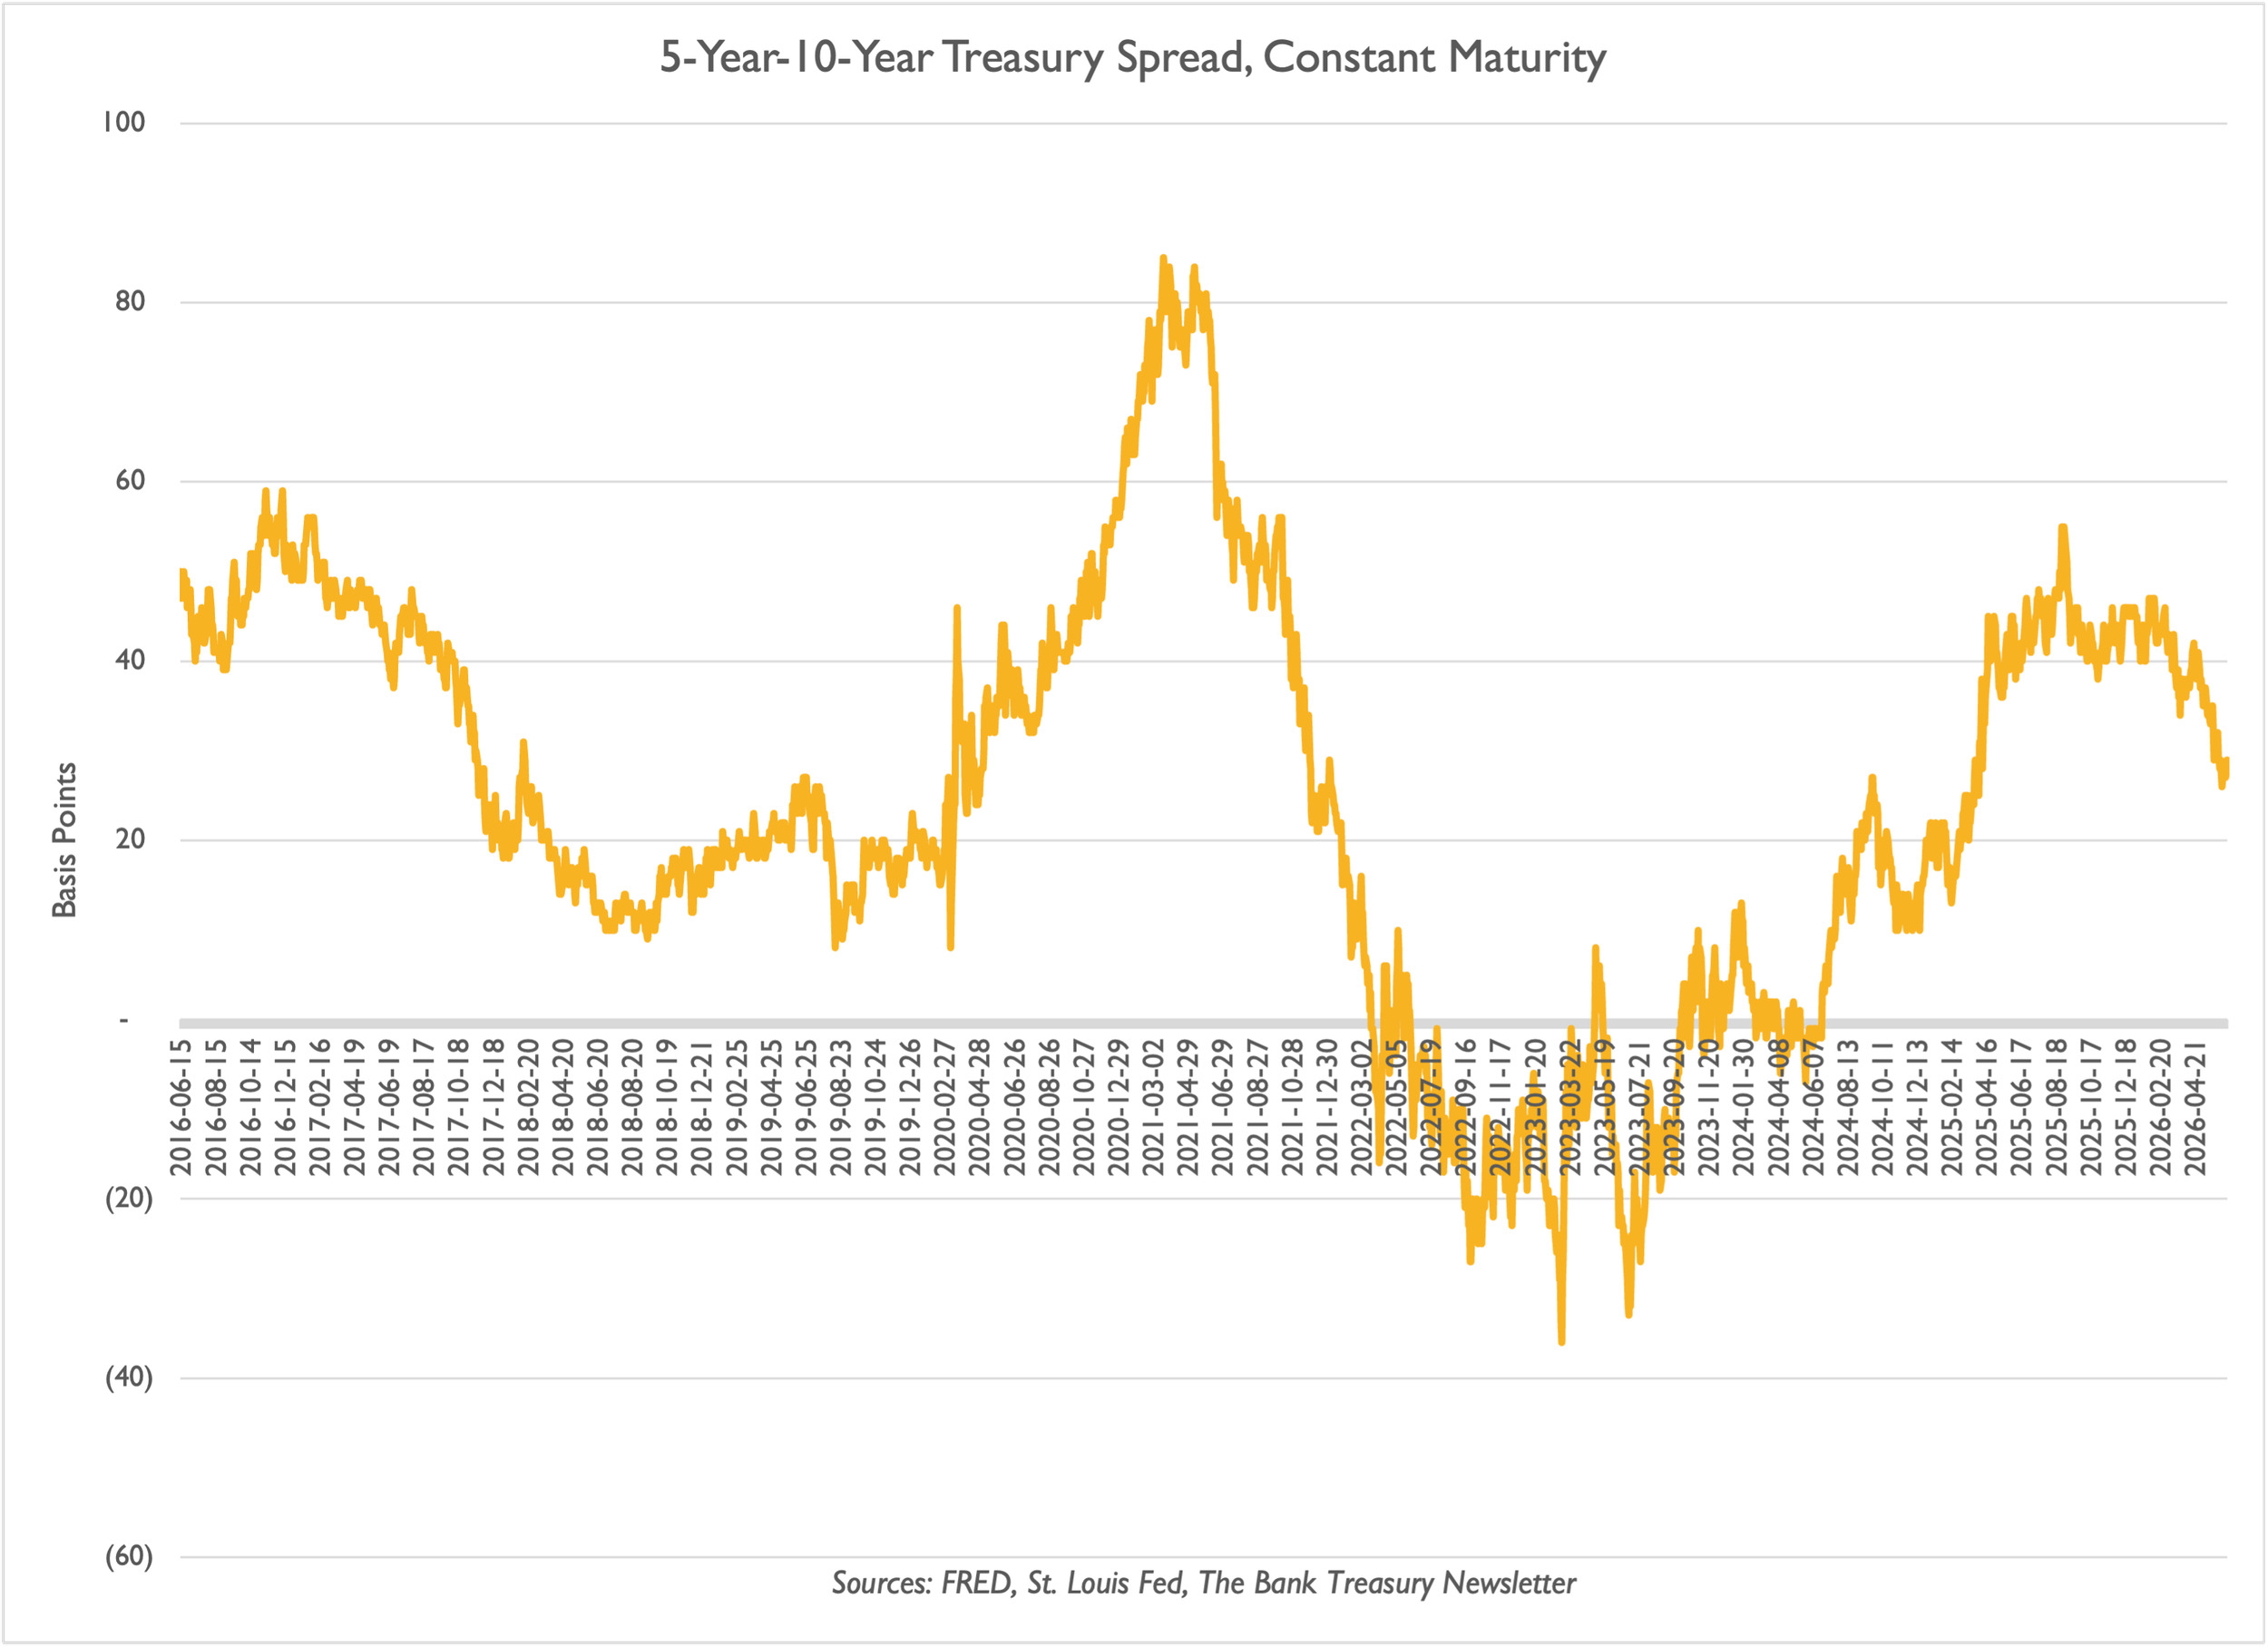
…But the Belly of the Curve Keeps Flattening
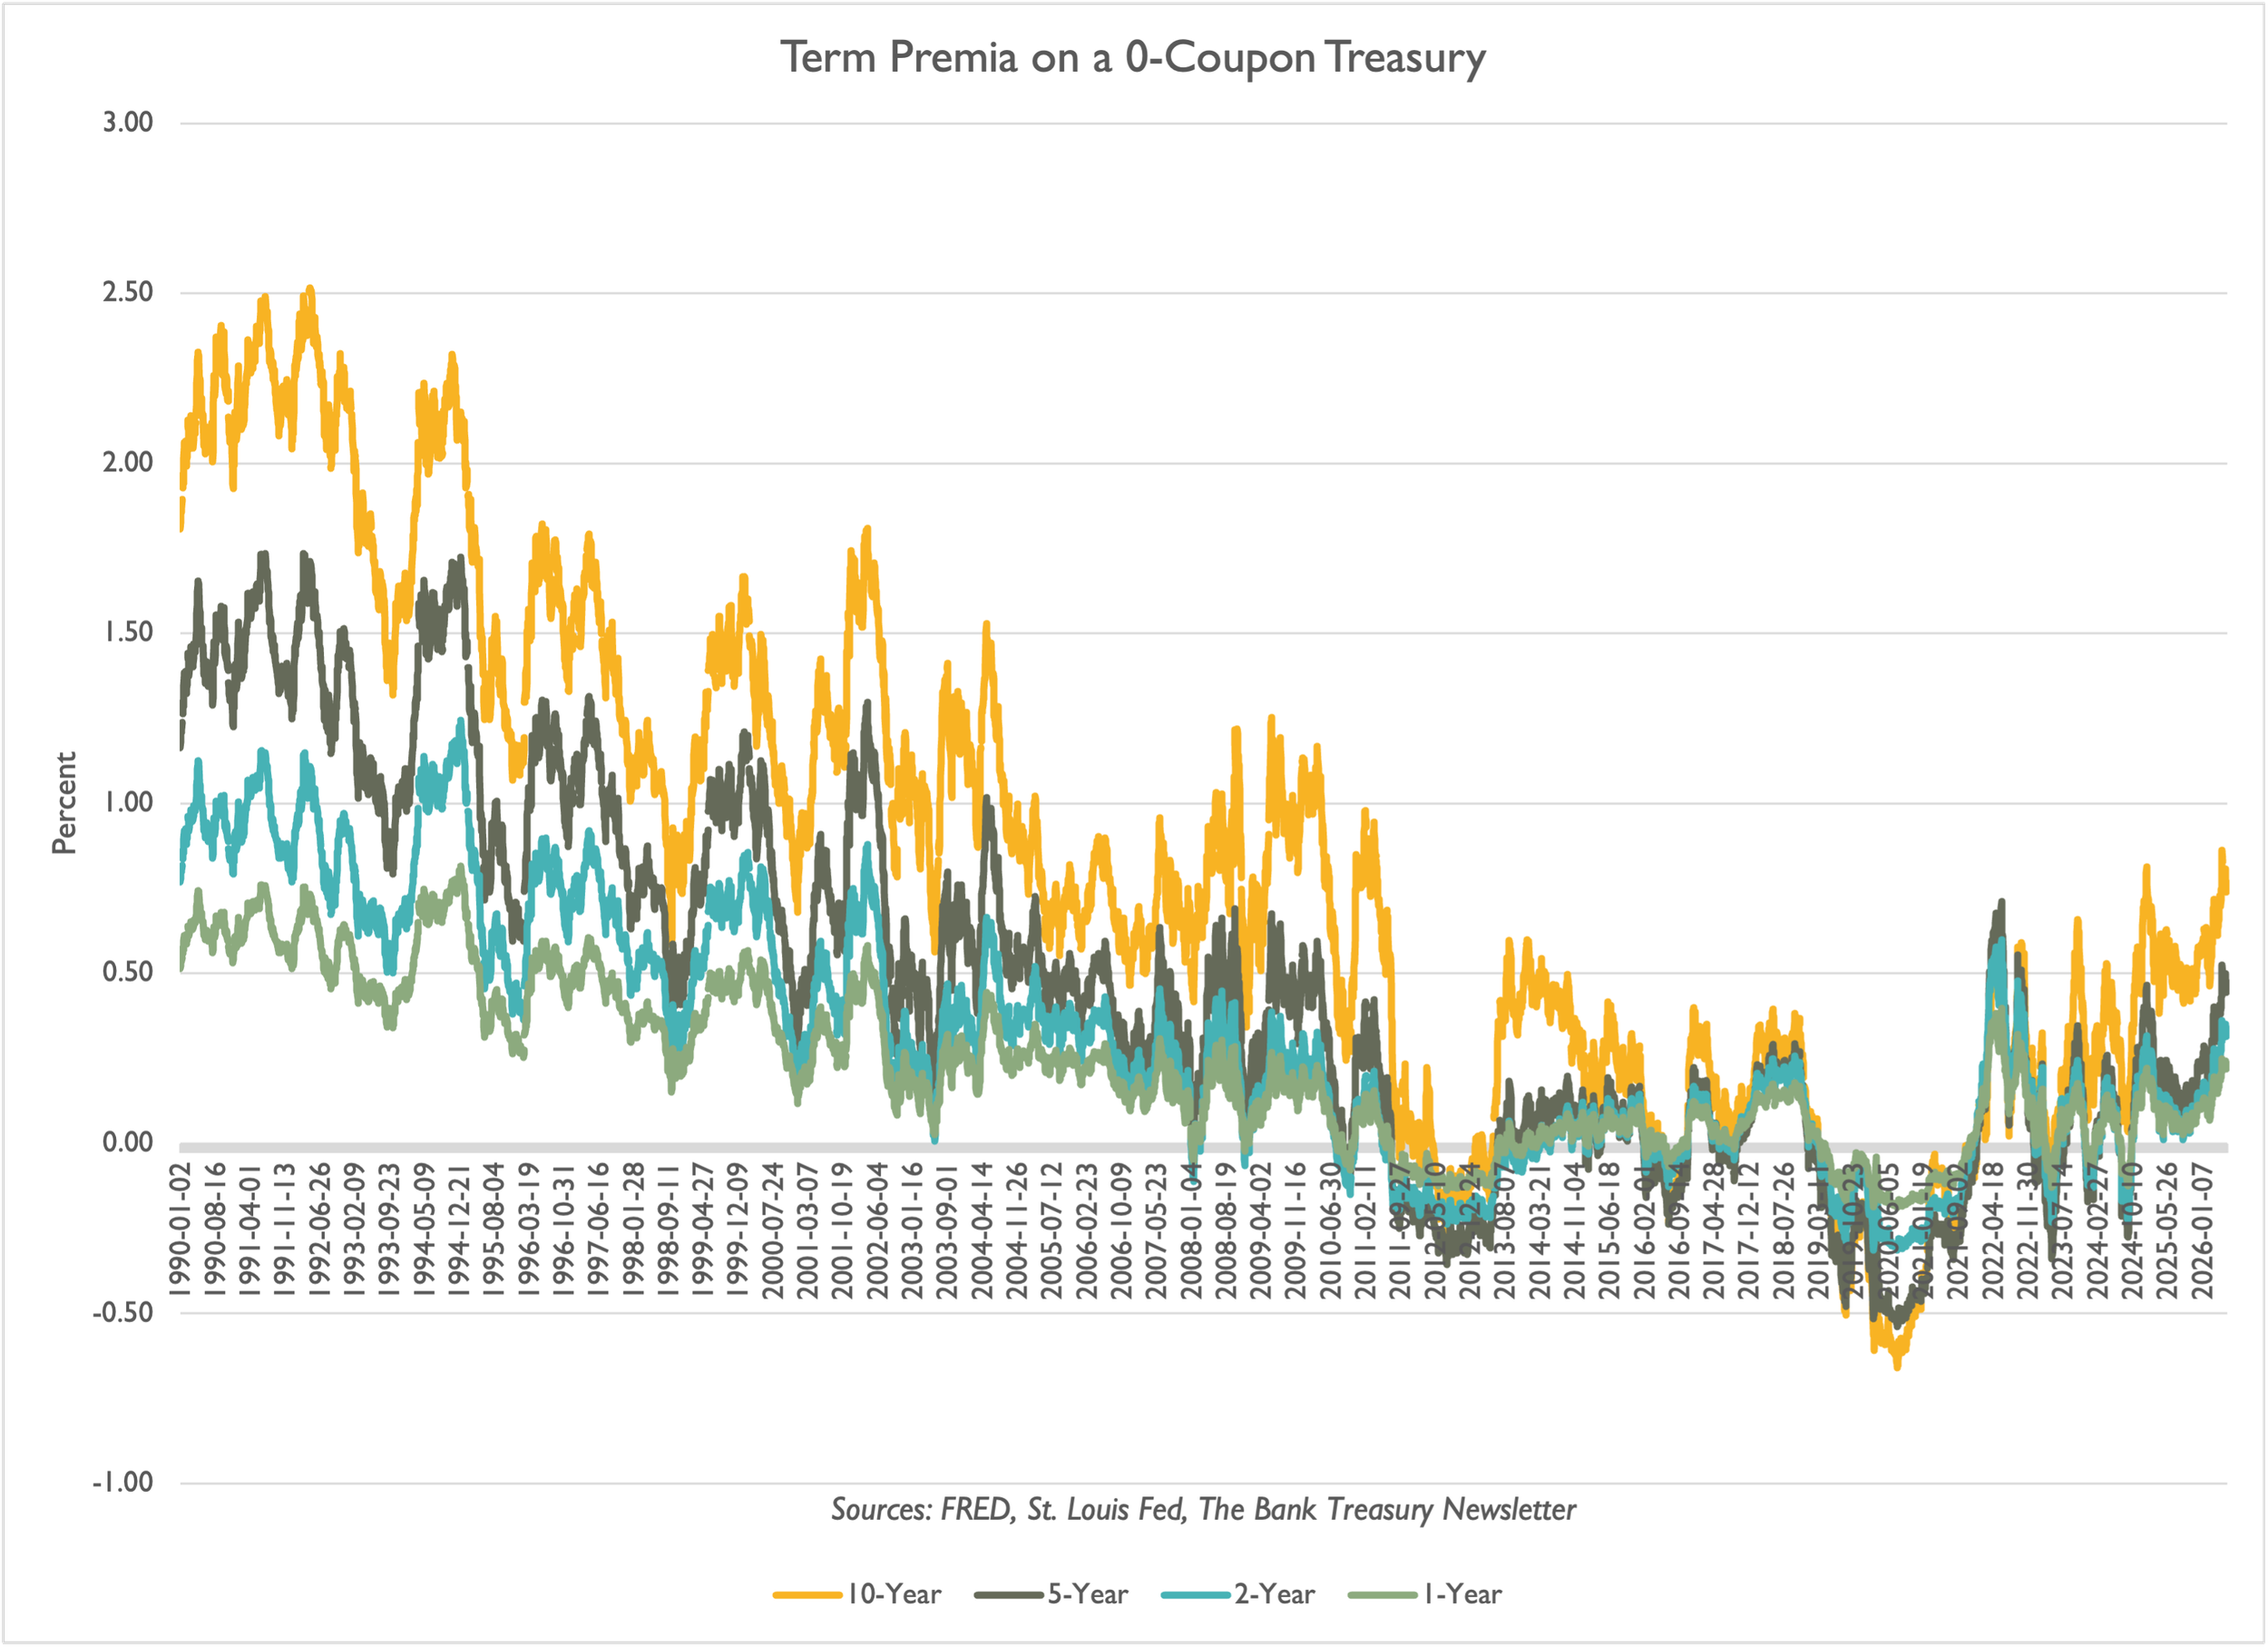
Investors Earn Higher Returns on Extension
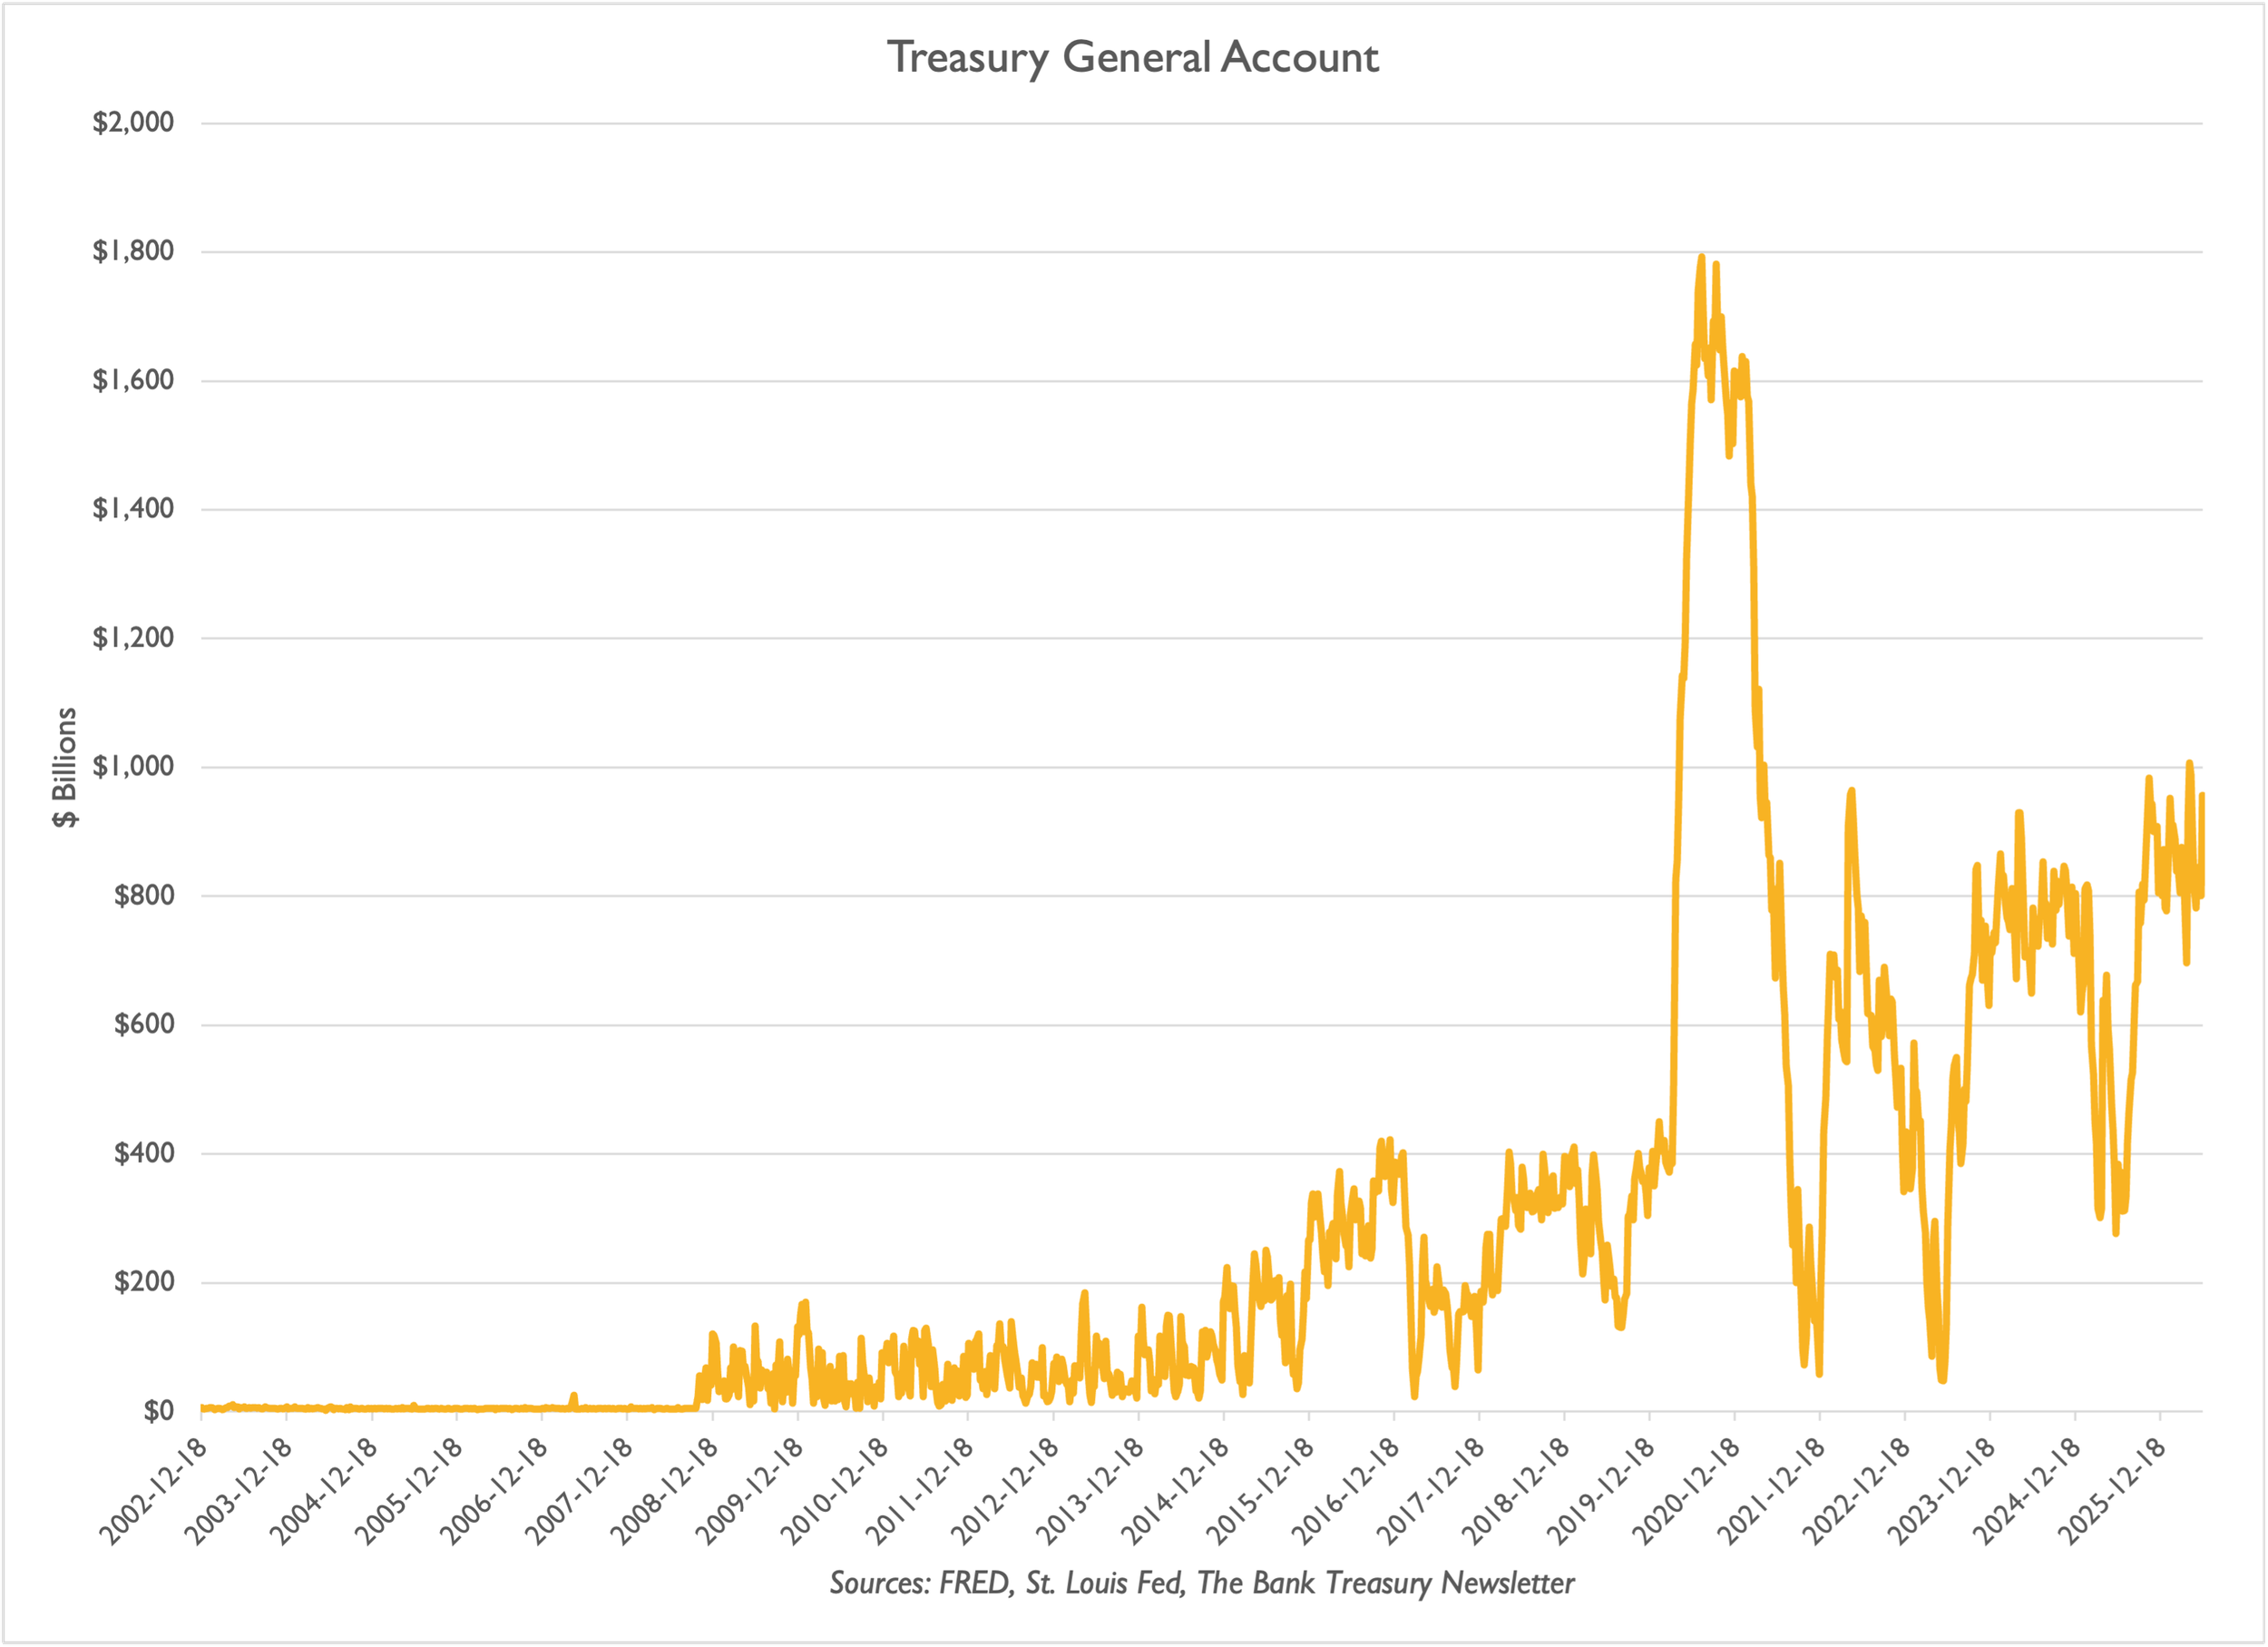
TGA Drives the Fed’s Balance Sheet Higher
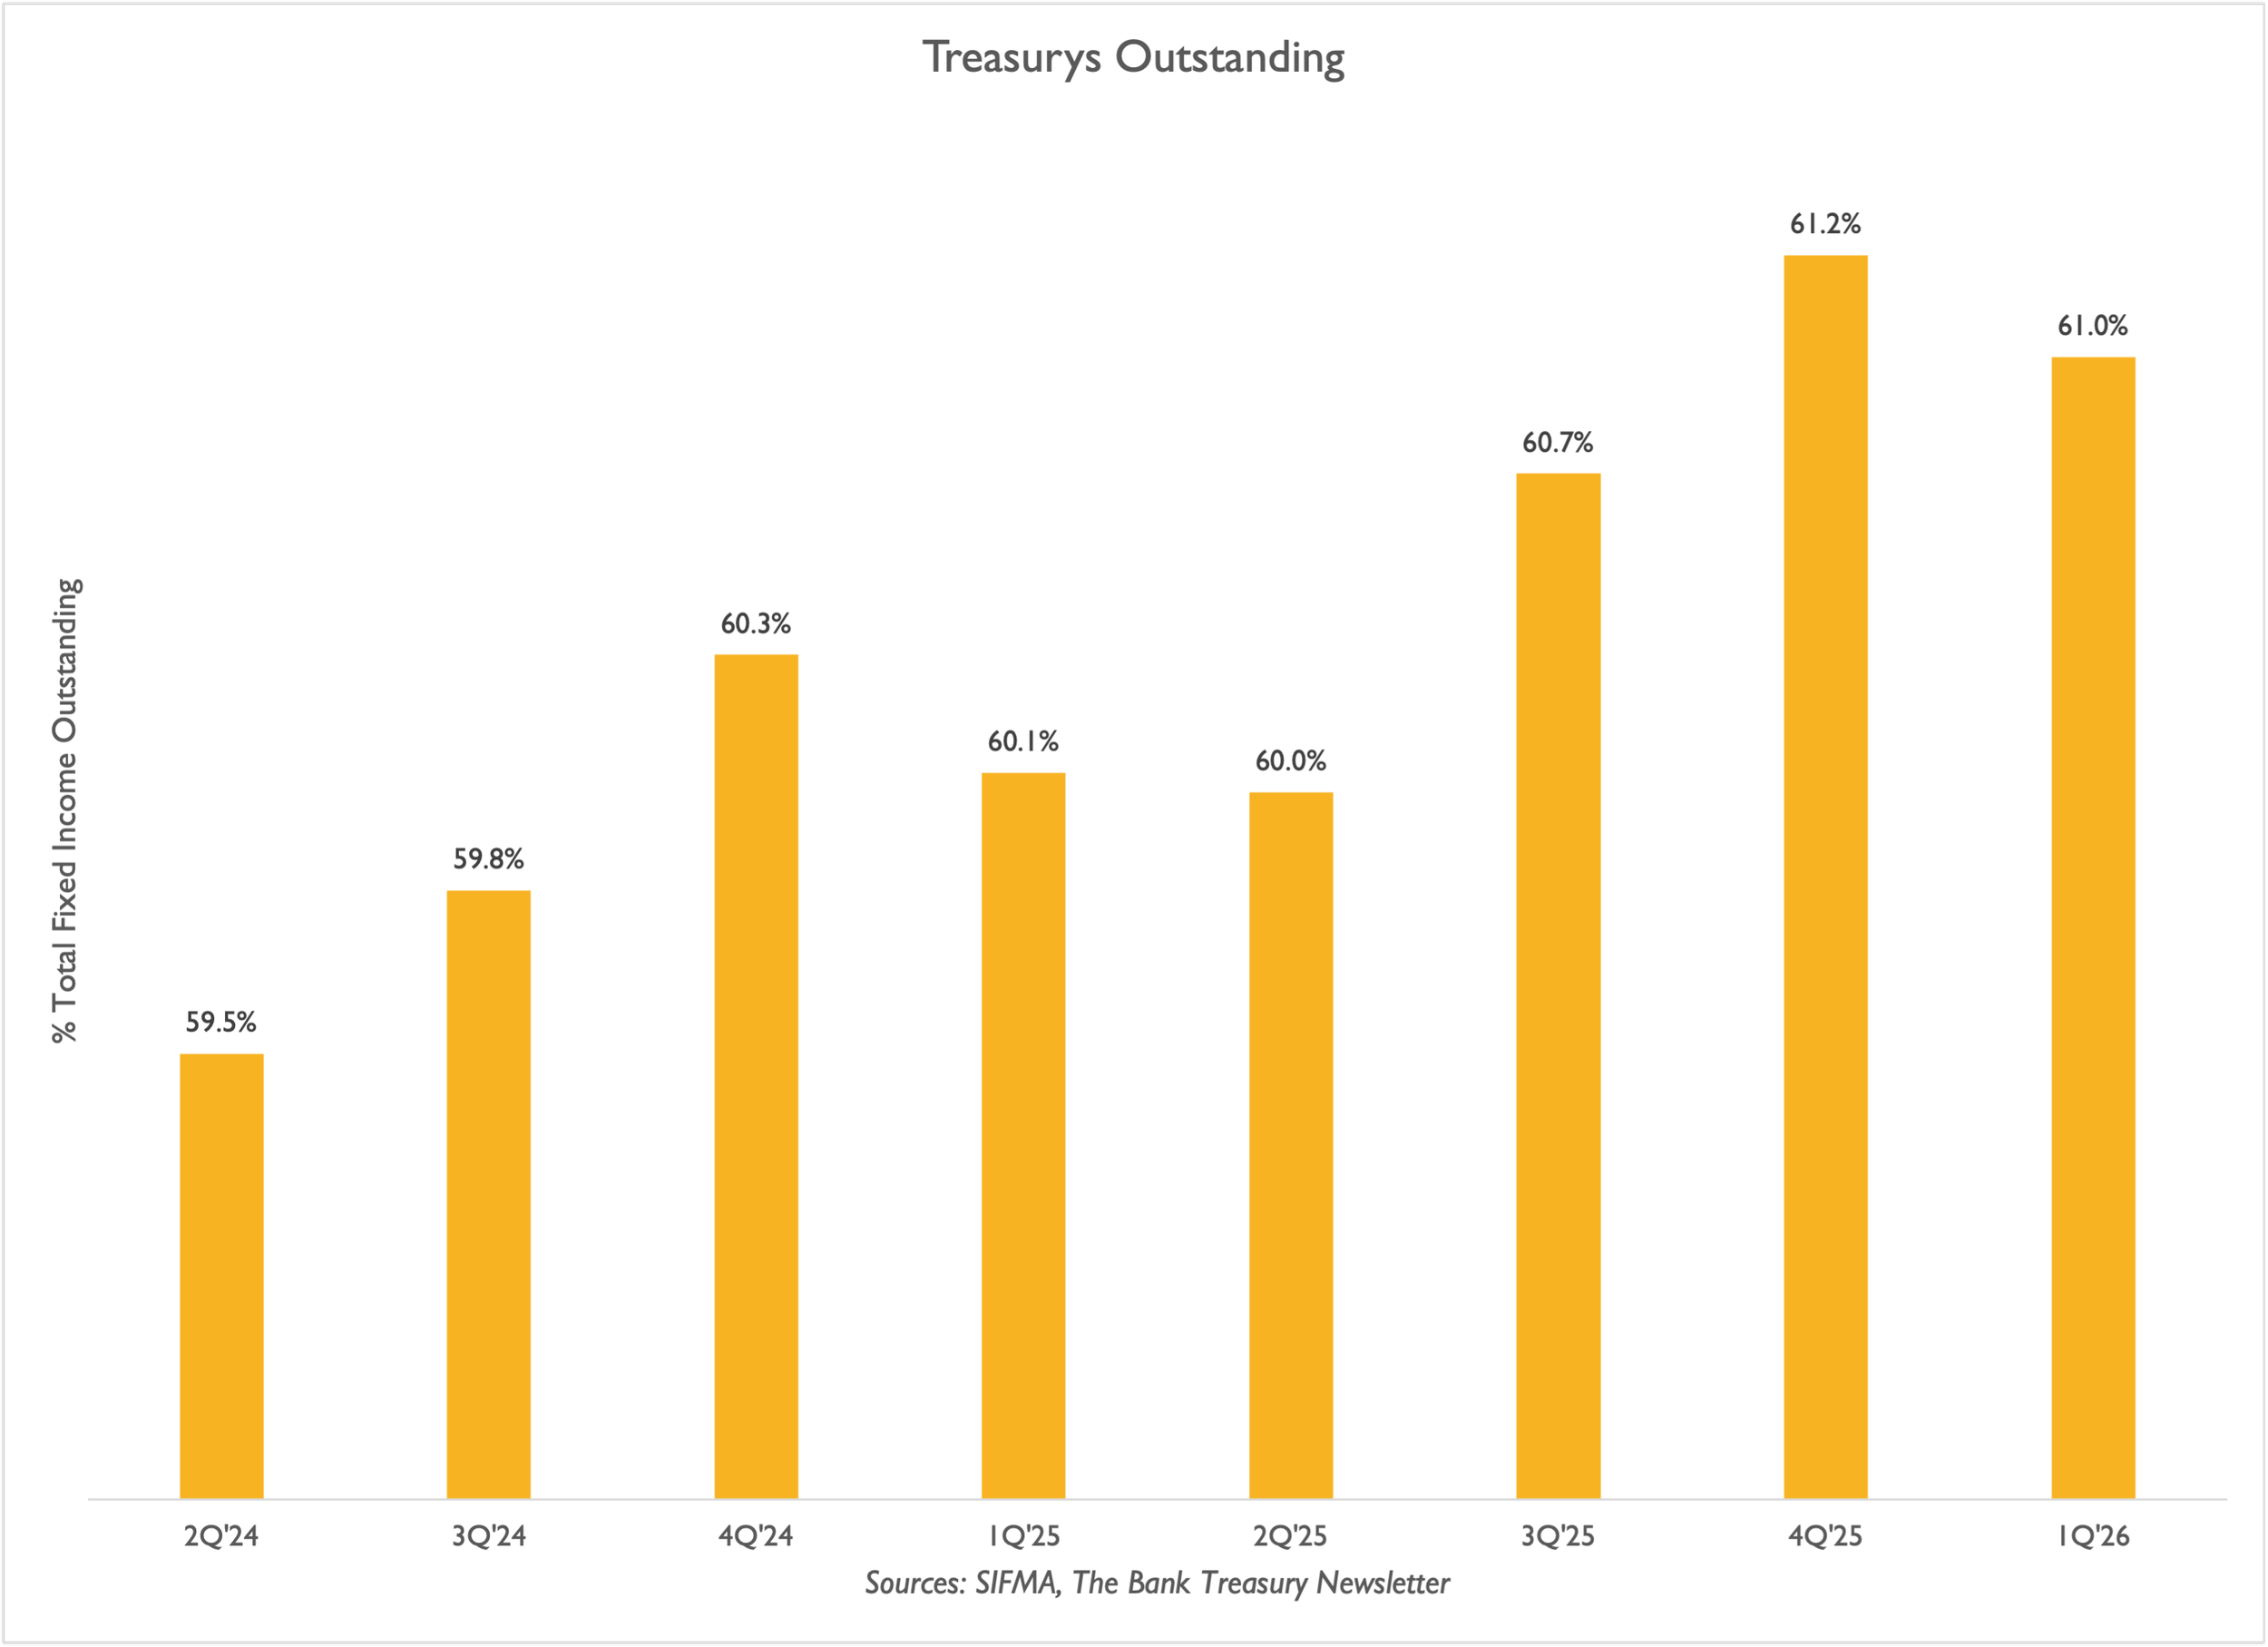
Treasury Debt Crowding Out Other Debt
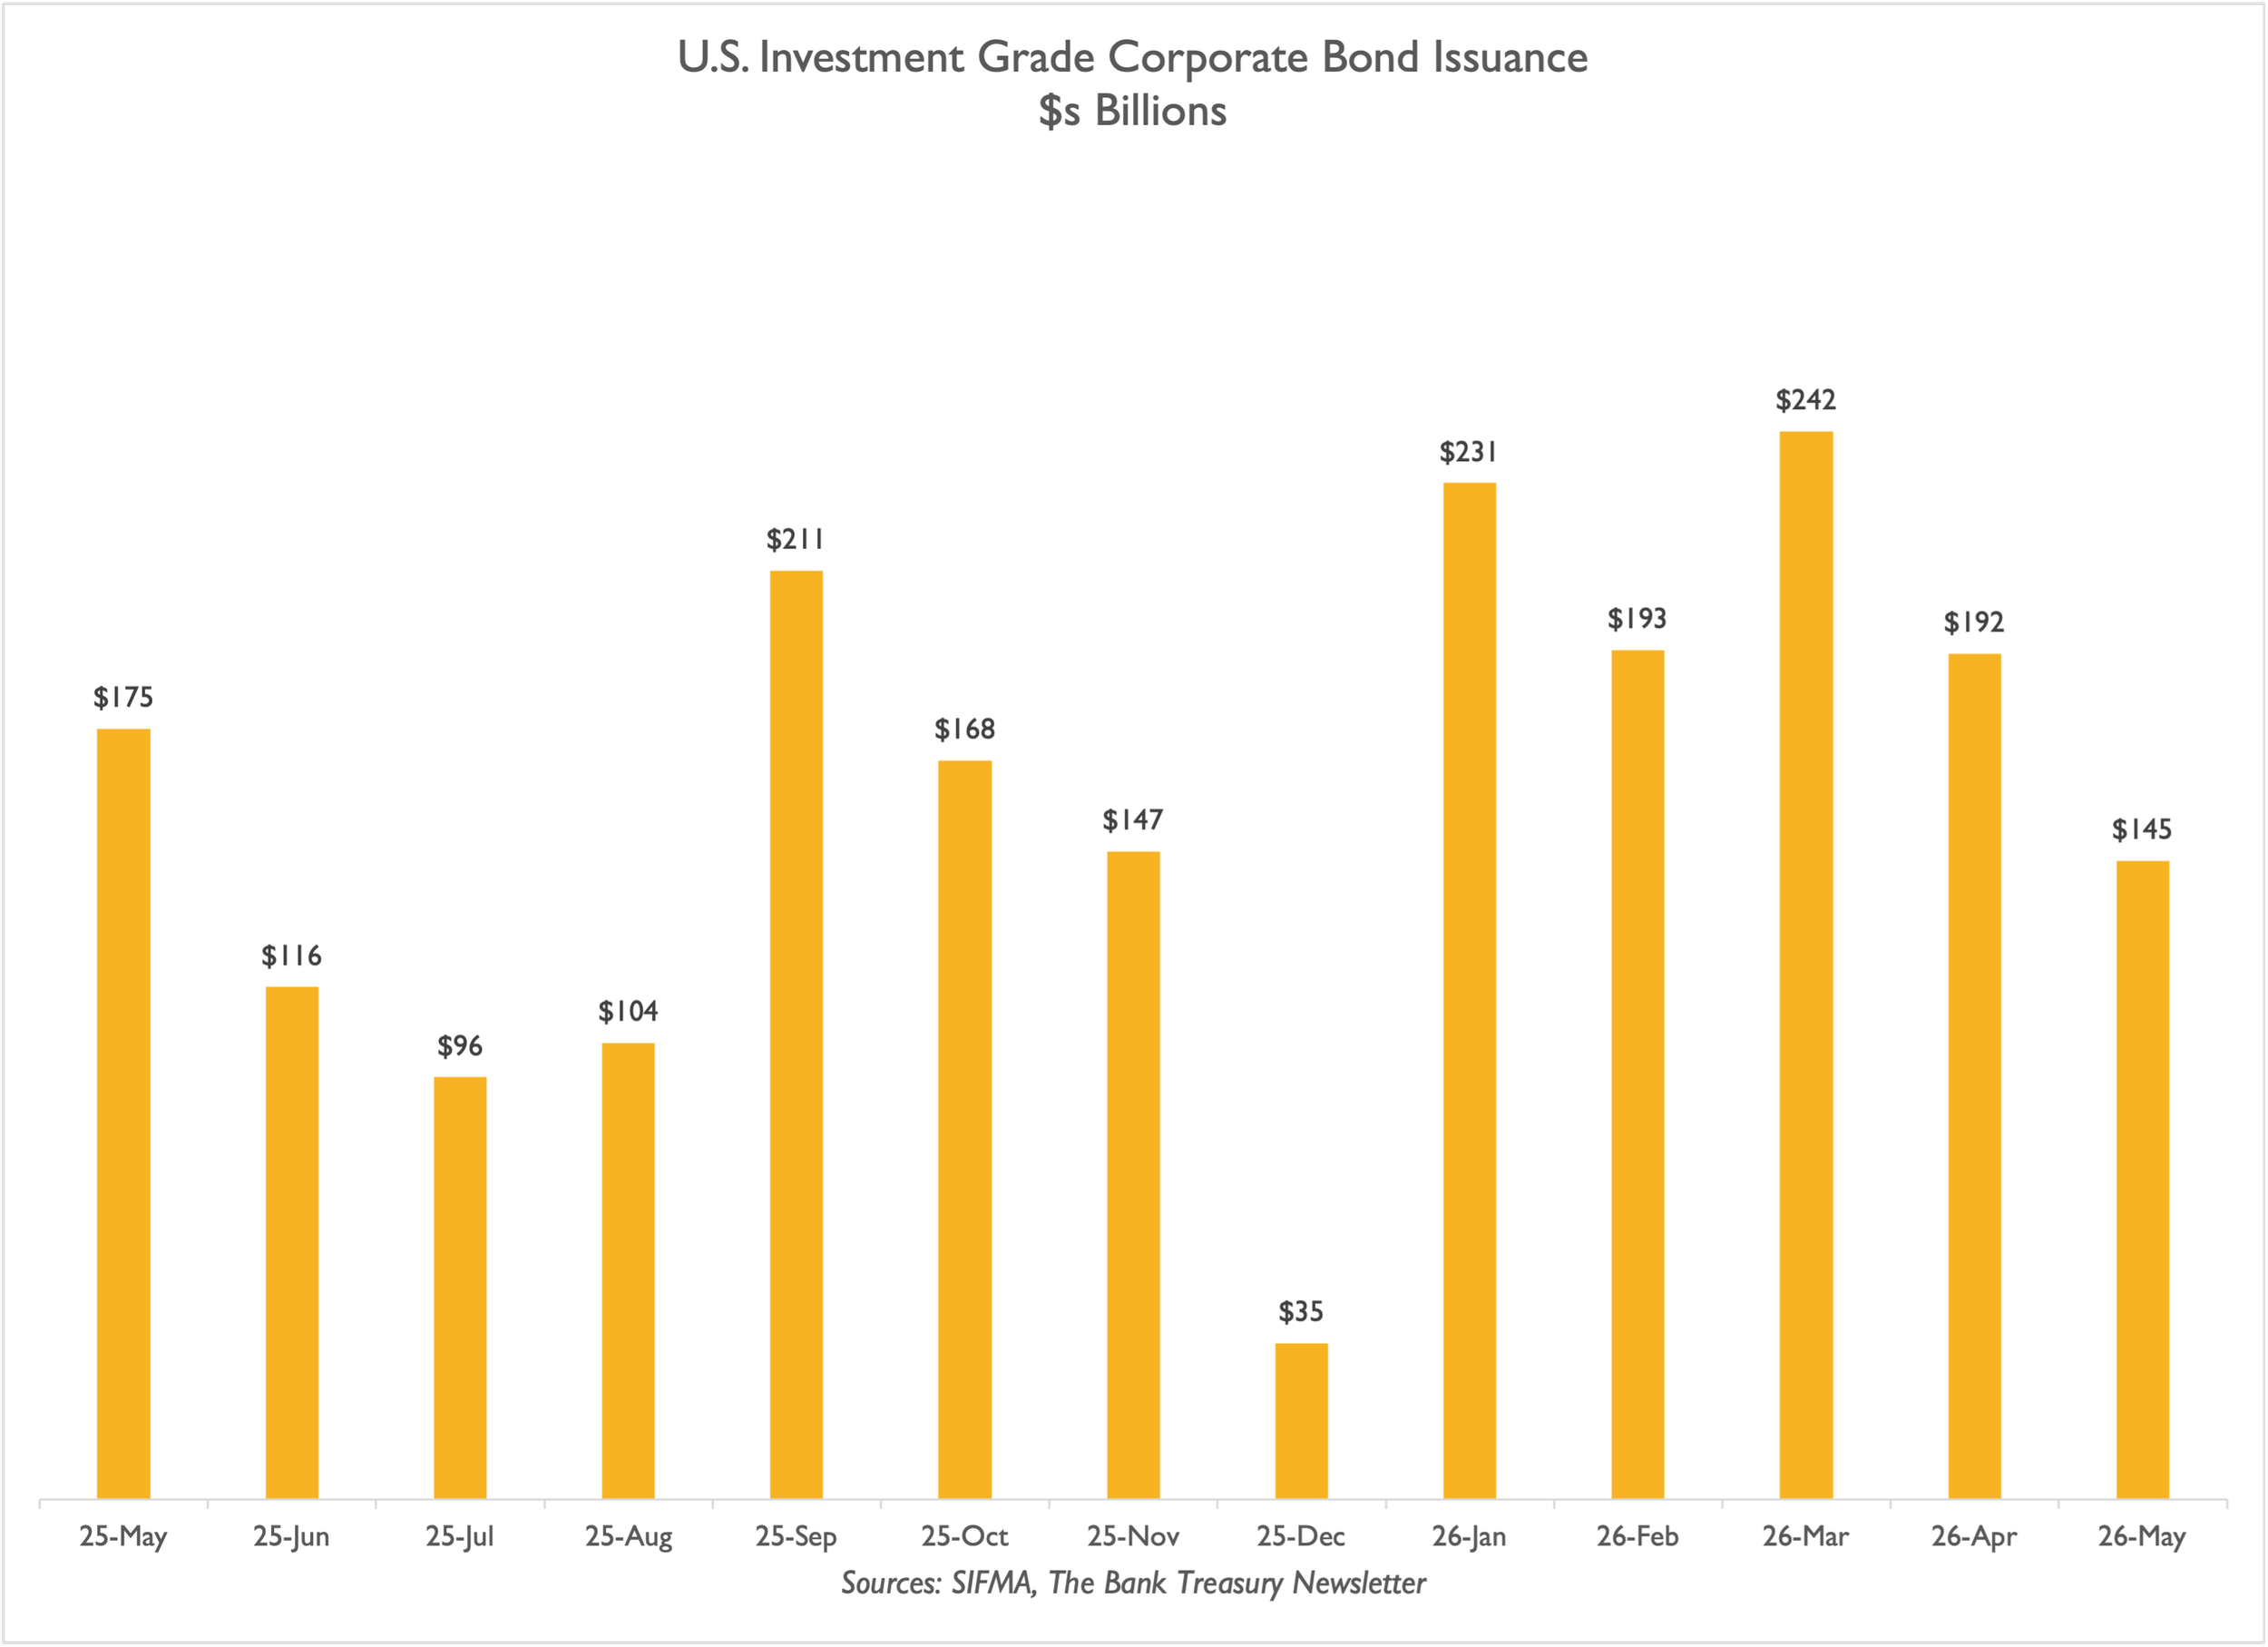
High-Grade Debt Issuance Tops $1 Trillion YTD
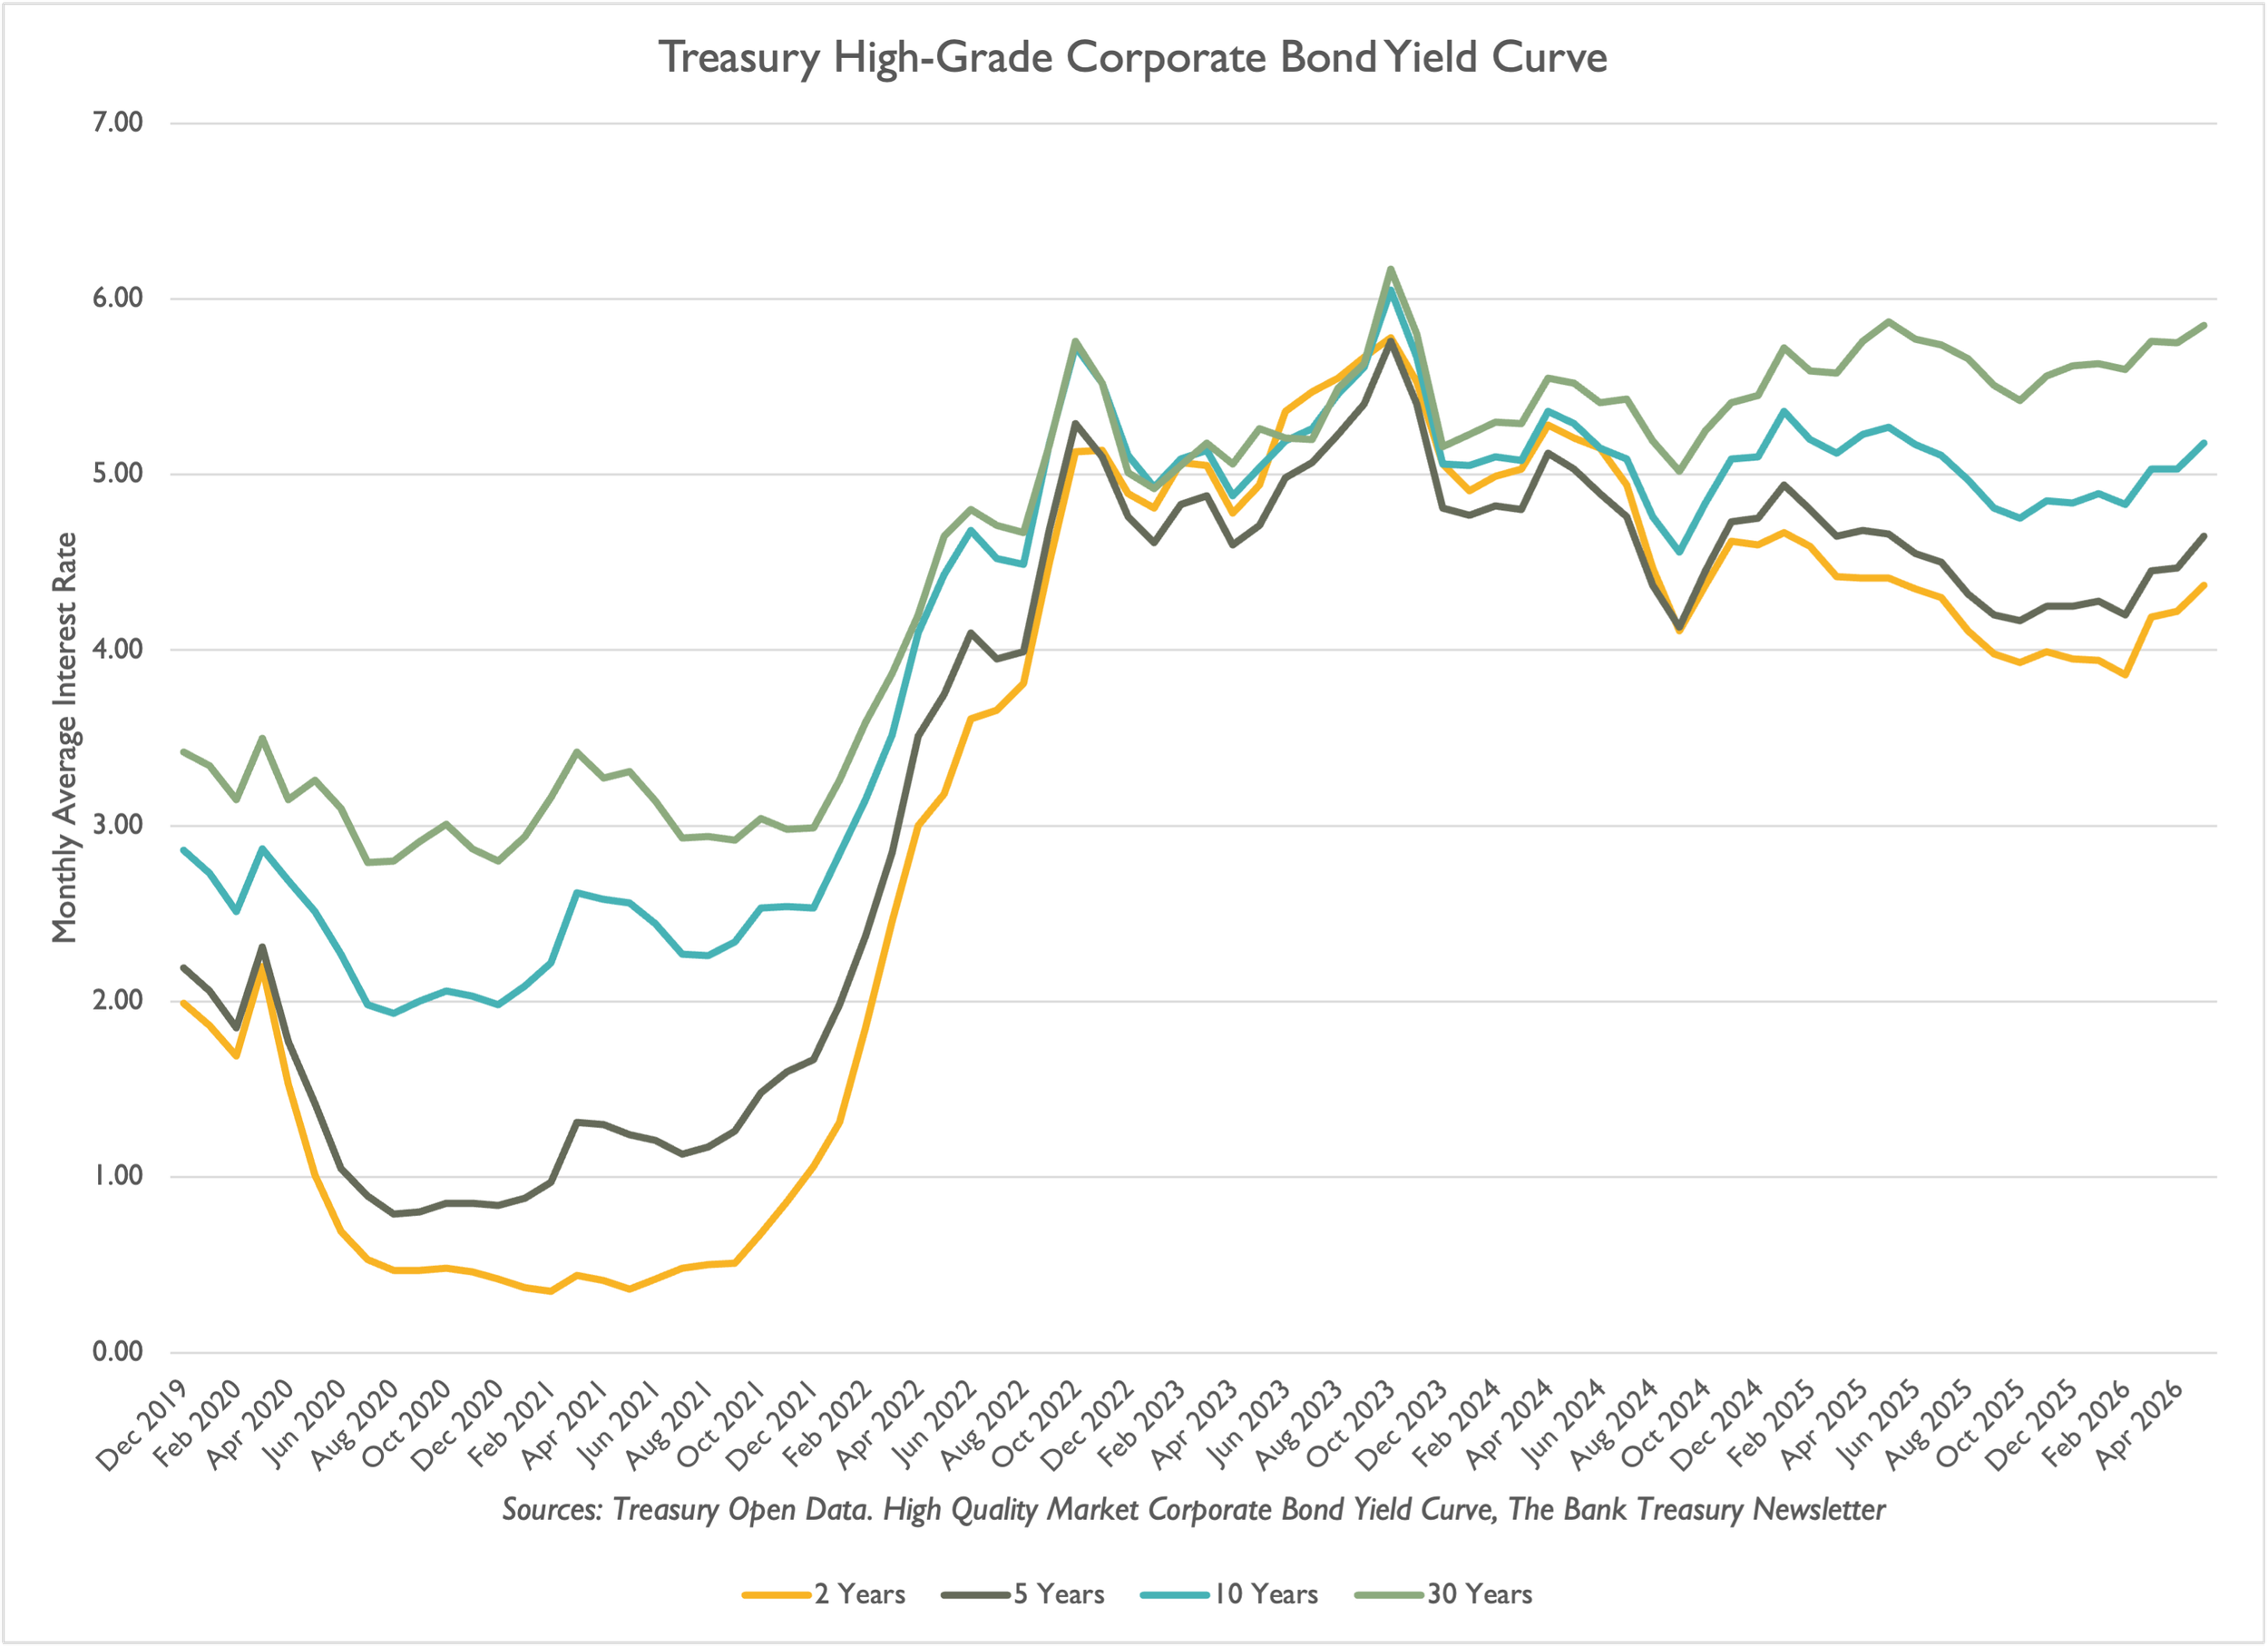
Corporate Bond Yield Curve Steepens
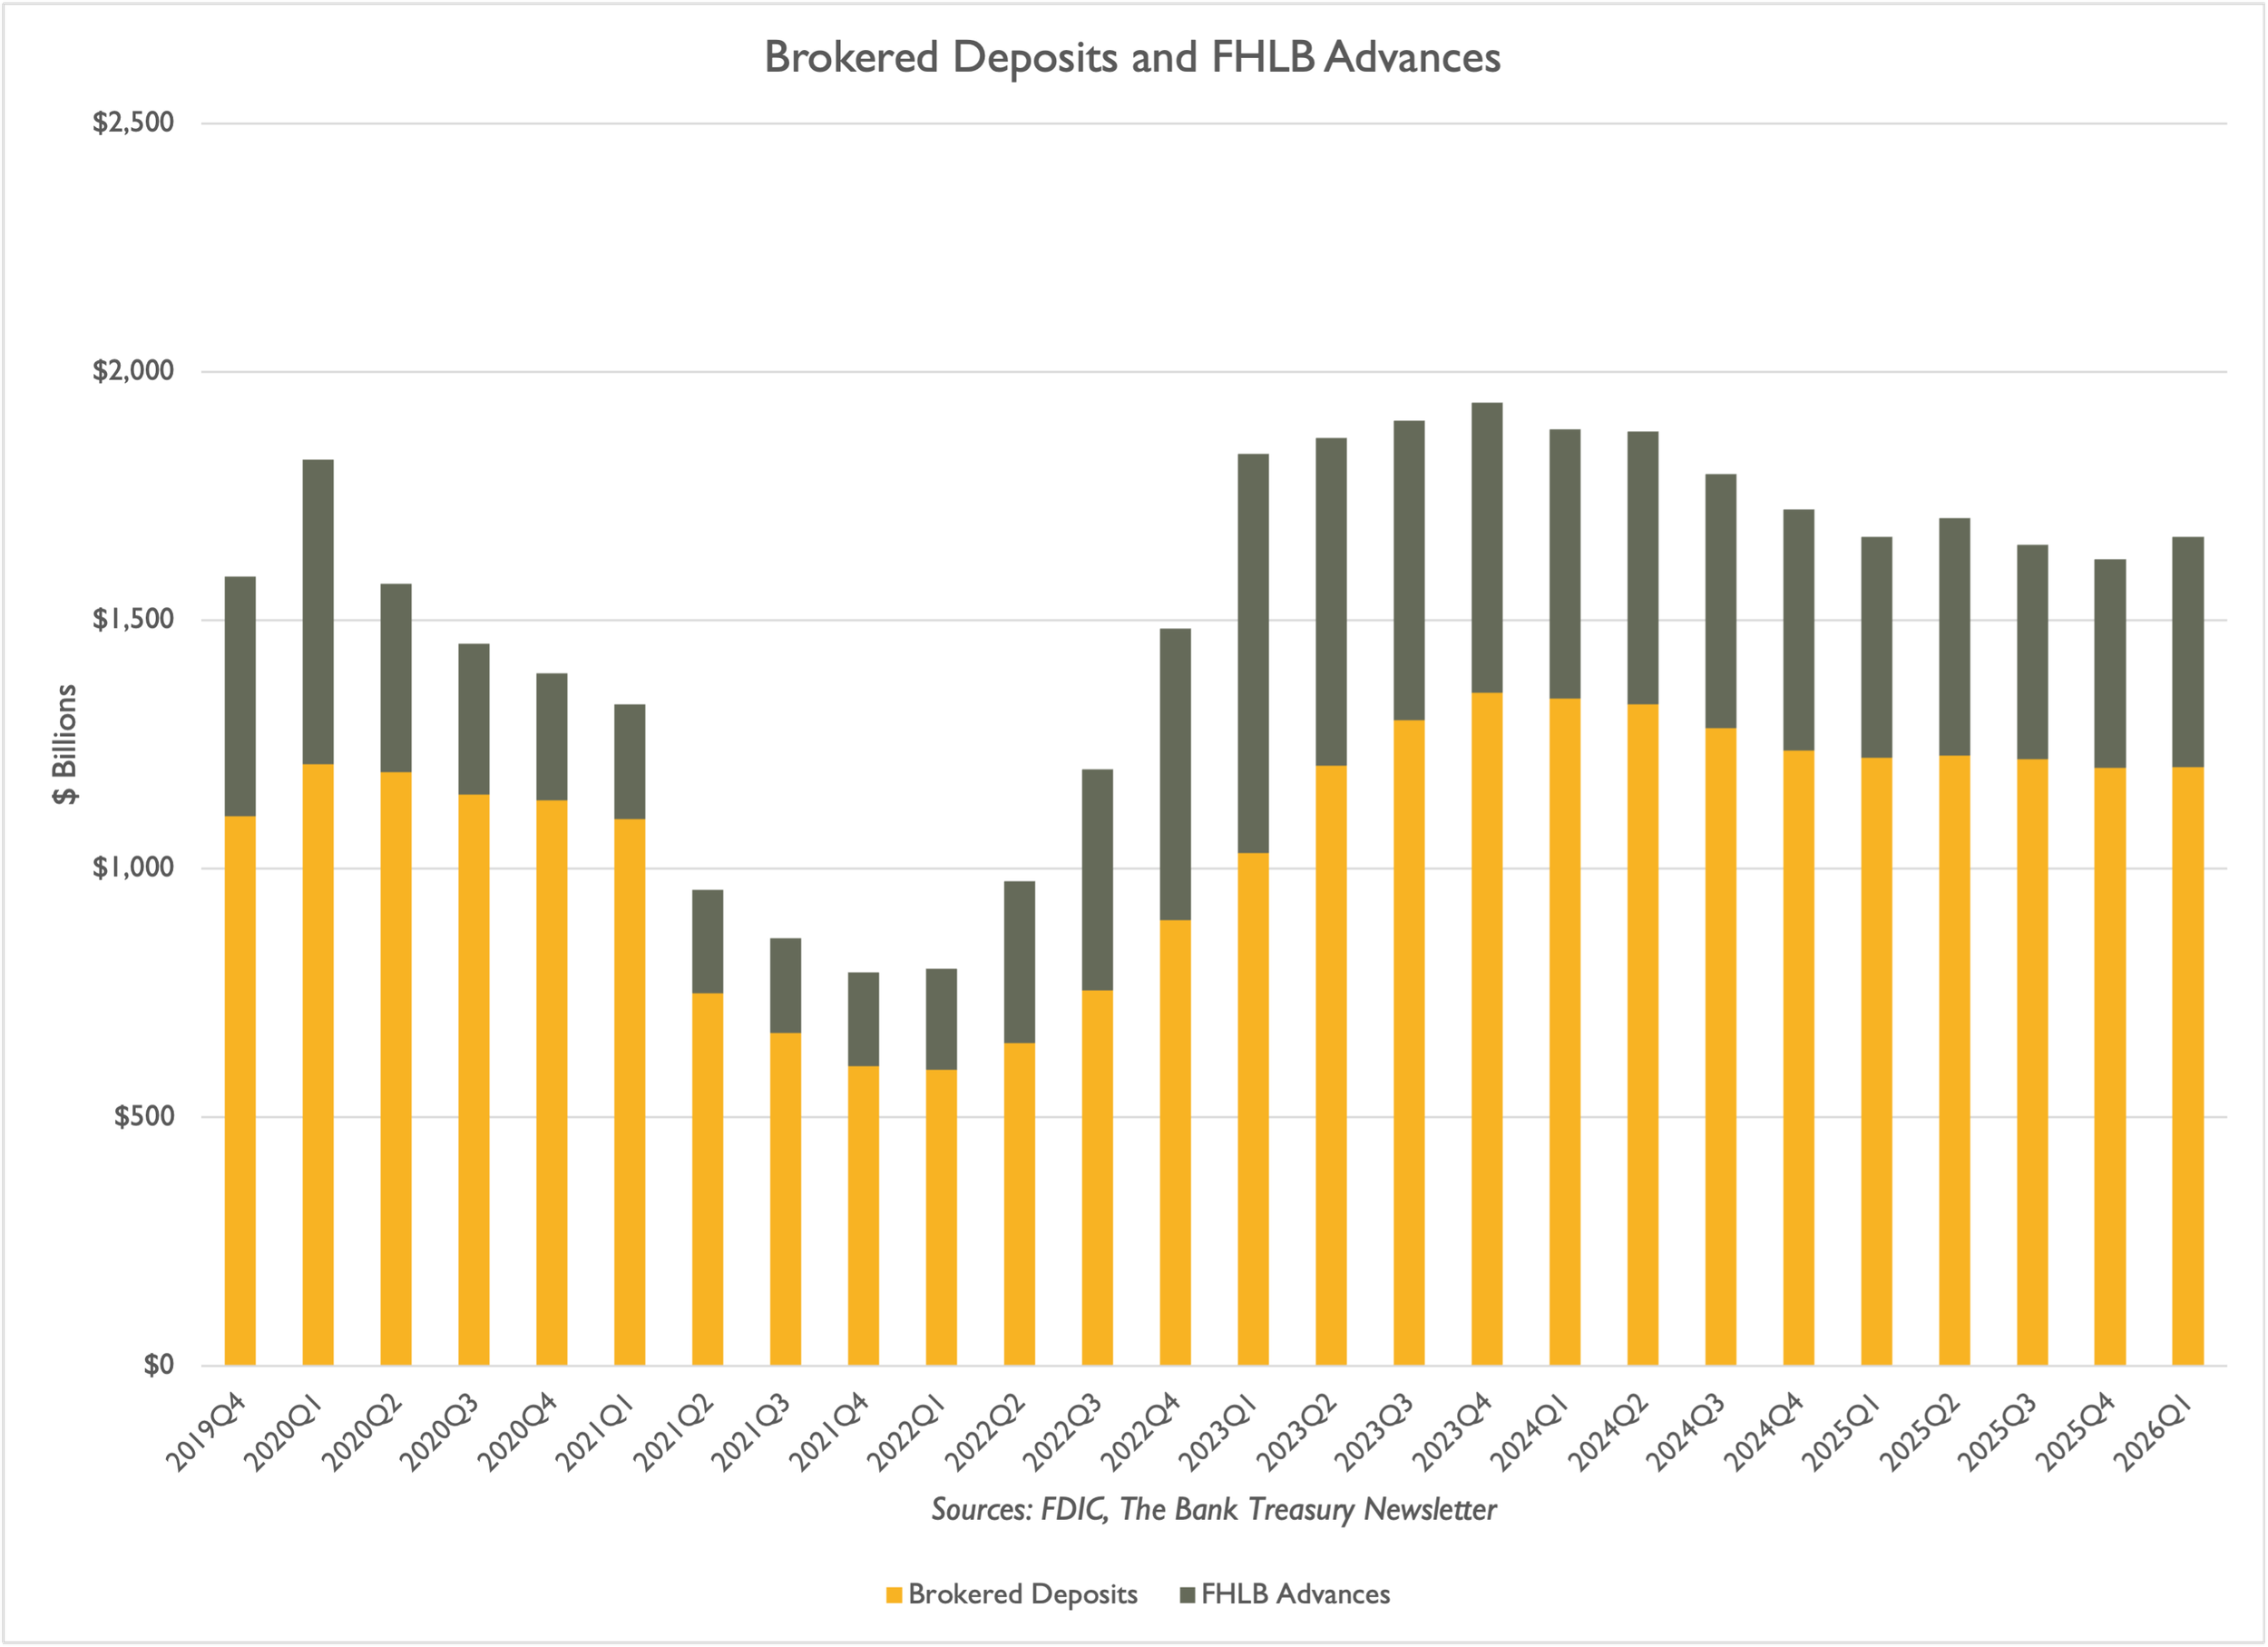
Brokered CDs Roll Off, FHLB Advances Roll On
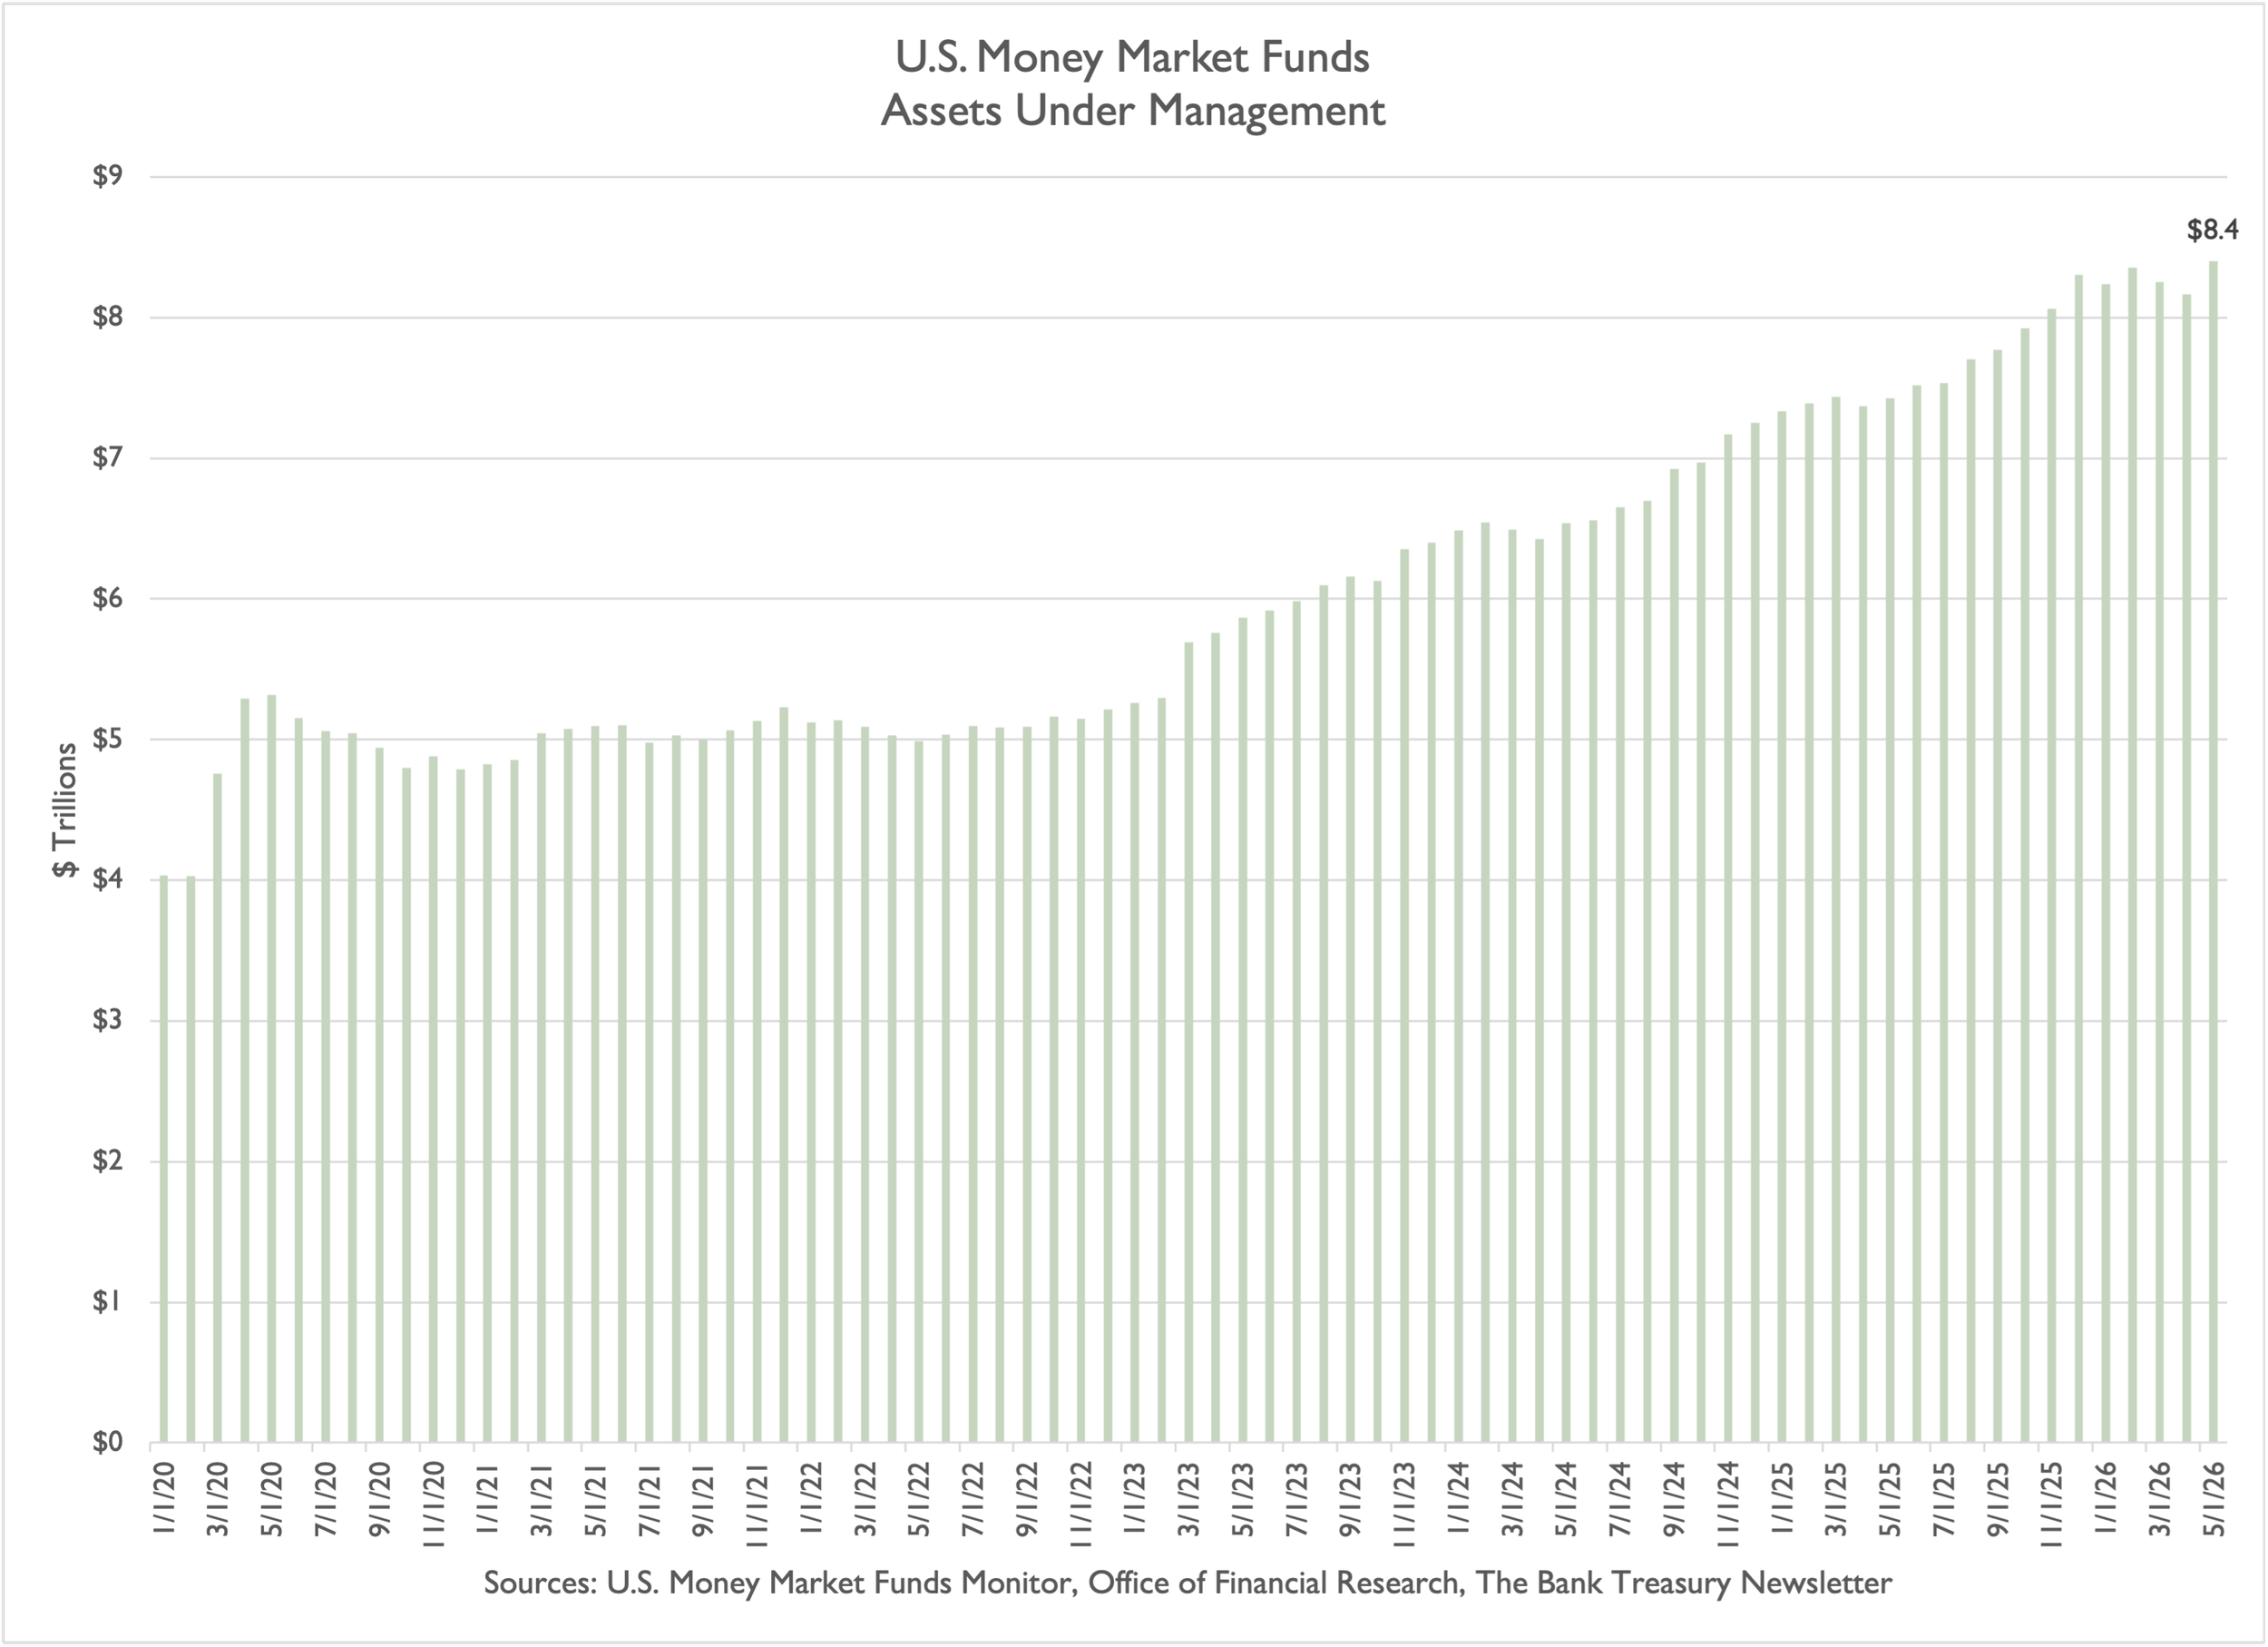
Money Market Funds Reach New Heights